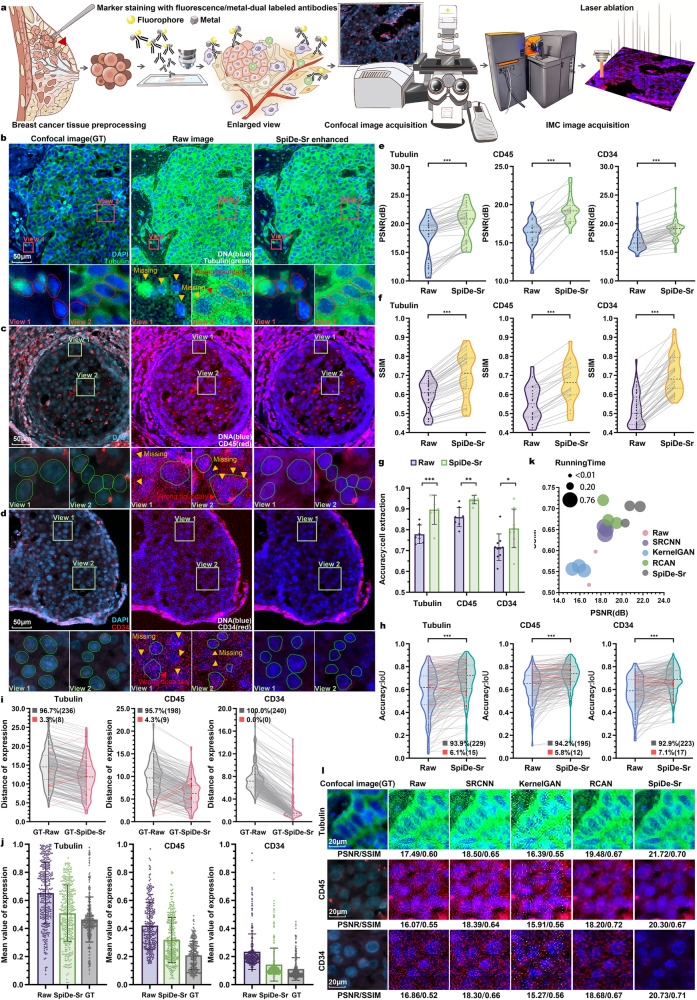
Fig. 4. Validation of SpiDe-Sr on IMC images of human breast cancer tissues.
a Schematic of acquiring paired images of breast cancer tissues with fluorescent/metal dual-labeled antibodies. b–d Confocal microscopy (left), raw IMC (middle), and SpiDe-Sr enhanced IMC (right) images of nucleus and examples of relatively high/moderate/low expression markers (b Tubulin/c CD45/d CD34). Cell segmentation was conducted with Cellpose. The missed cells and wrong boundary were, respectively, indicated by yellow and red arrows. Correctly extracted but wrongly bounded regions were indicated by red arrows. e, f Violin-scatter plots showing the distribution of (e) peak signal-to-noise ratio (PSNR) and (f) structural similarity (SSIM) with ground truth (GT) images before and after SpiDe-Sr enhancement. Each gray line represented the variation of a single image before and after enhancement. n = 47 (Tubulin)/25 (CD45)/54 (CD34) images. g Accuracy of cell extraction before and after SpiDe-Sr enhancement. Data were presented as mean values ± SD. n = 7 (Tubulin)/8 (CD45)/10 (CD34) images. h Violin-scatter plots showed the distribution of intersection over union (IoU) of accurately extracted cells in IMC images before and after SpiDe-Sr enhancement vs. GT images. Each line represented the variation of a single cell before and after enhancement. Increasing and decreasing pairs were colored in gray and red, respectively. i Violin-scatter plots showed the distance of biomarker expressions in accurately extracted cells from IMC images with and without SpiDe-Sr enhancement to the corresponding cells in GT images. Each line represented the variation of a single cell before and after enhancement. Increasing and decreasing pairs were colored red and gray, respectively. j Normalized marker expressions in accurately extracted cells. Data were presented as mean values ± SD. In (h–j), n = 244 (Tubulin)/207 (CD45)/240 (CD34) cells. k Comparison of SpiDe-Sr method with the three competitive SR methods in PSNR, SSIM, and running time. l Visual comparison of SpiDe-Sr method with the three competitive super-resolution methods. In (e–h), asterisks indicate statistical significancy by paired-samples two-sided t-test, *P < 0.05, **P < 0.01, ***P < 0.001. Source data are provided as a Source data file.

