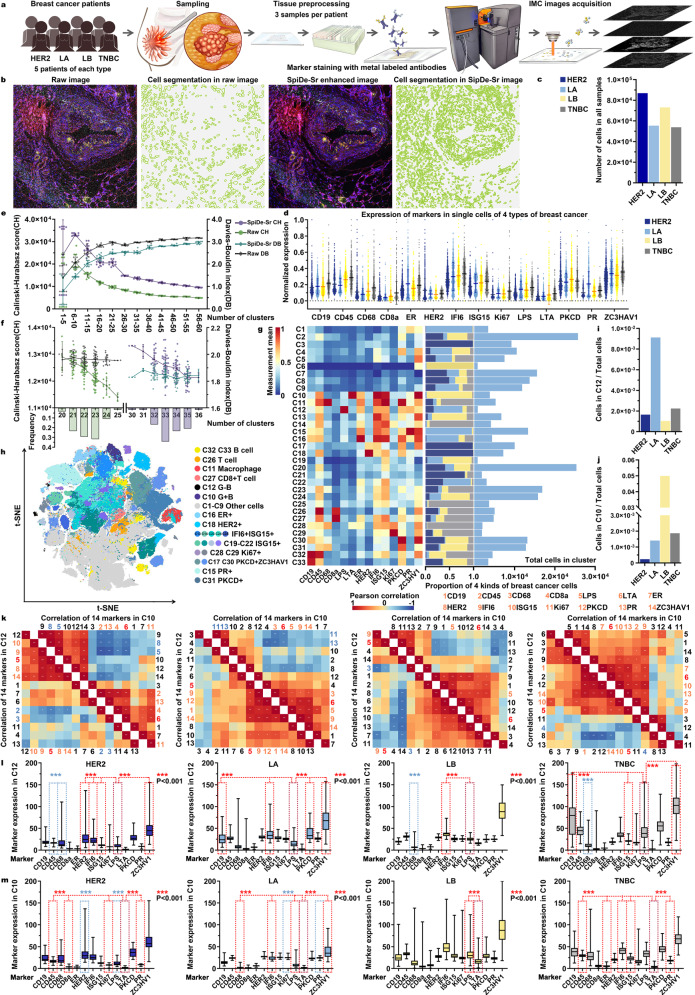
Fig. 5. Application of SpiDe-Sr to spatial proteomics data from four major subtypes of breast cancer patients.
a Workflow of IMC image acquisition. b A raw breast cancer IMC image and extracted cells (left), compared with the corresponding SpiDe-Sr enhanced image and extracted cells (right). c Number of cells. d Normalized expressions of 14 markers at single-cell level (n = 8697/5550/7316/5393 for HER2/LA/LB/TNBC). e CH and DB scores of FlowSOM clustering results. f CH and DB of PhenoGraph clustering results. Histogram showed the frequency distribution of cluster numbers. In (d–f), data were presented as mean ± SD. In (e–f), both CH and DB were statistically different before and after SpiDe-Sr enhancement (two-sided t-test, P < 0.001). g The clustering result with the highest CH score. The heat map (left) showed normalized mean marker expressions of each cluster. The stacked bar plot showed (middle) the proportions of four breast cancer cells in each cluster. The bar plot (right) showed the absolute cell counts in each cluster. h t-SNE (t-distributed stochastic neighbor embedding) map of 269,556 cells sub-sampled from all images. Cell clusters were marked by different colors. i, j The proportion of cells of each breast cancer in the clusters which had the highest expression of G- (i, C12, n = 144/506/76/121 cells) and G+ (j C10, n = 21/78/3654/101 cells) bacterial markers, compared to the total cell count of each subtype. k (below) Heat map showing the Pearson correlation coefficients of the 14 markers in C12 with each other. (above) Heat map showing the Pearson correlation coefficients of the 14 markers in C10 with each other. Positively and negatively correlated markers were colored in orange and blue, respectively. LPS and LTA were colored in red. l–m Box plots showed the absolute expressions of 14 markers in C12 (l n = 847 cells) and C10 (m n = 3854 cells) of the four breast cancer subtypes. Red and blue asterisks, respectively, represented the statistical significance of proteins positively and negatively associated with LPS/LTA versus LPS/LTA (two-sided t-test, **P < 0.01, ***P < 0.001). Source data are provided as a Source data file.

