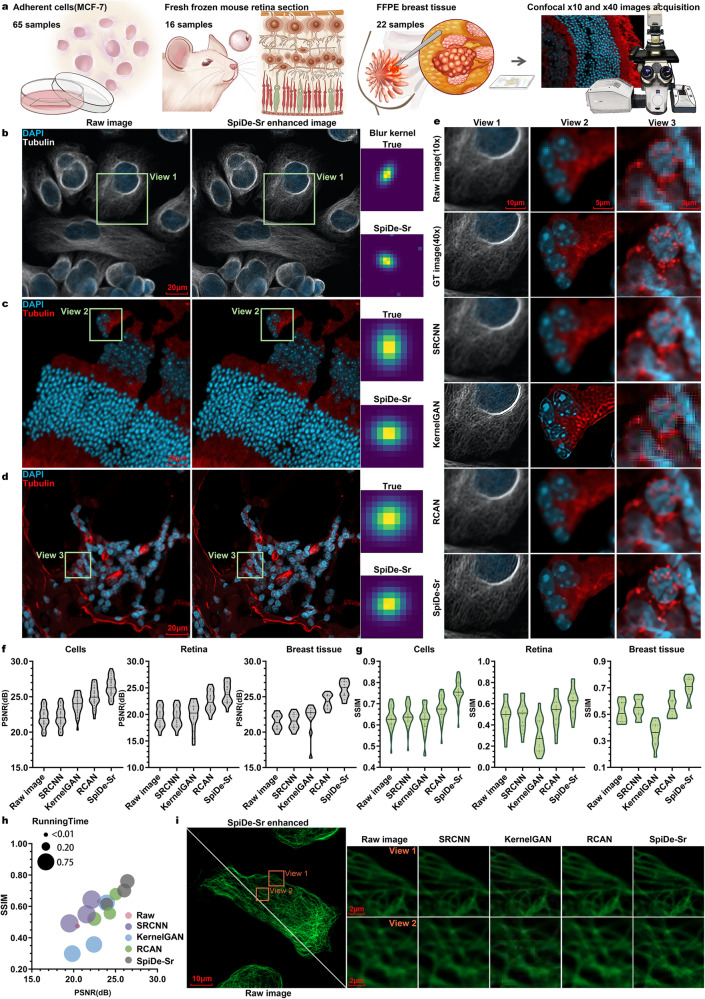
Fig. 6. Migrating SpiDe-Sr to fluorescence microscopy images.
a Paired images at different magnifications (10× and 40×) were acquired for MCF-7 cell line, mouse retina, and breast tissue. b, d Raw images at 10× magnification (left) of MCF-7 cell (b), mouse retina (c), and breast tissue (d), and corresponding 40× images reconstructed from the 10× images using SpiDe-Sr (middle), along with the true blur kernels and the blur kernels between the 10× and SpiDe-Sr enhanced 40× images (right). e Comparison of the super-resolution images reconstructed by SRCNN, KernelGAN, RCAN, and SpiDe-Sr for the three sample types. f, g Comparisons of PSNR (f) and SSIM (g) among the four super-resolution methods in different sample types. n = 65/16/22 for MCF-7 cells/mouse retina tissues/human breast tissues. h Overall comparison of the PSNR, SSIM, and running time among the four super-resolution methods. i Visual comparison of 40× ground truth image of F-actin and 40× super-resolution image reconstructed from 10× image using SpiDe-Sr, as well as the other three methods. FFPE formalin fixed paraffin embedded. Source data are provided as a Source data file.

