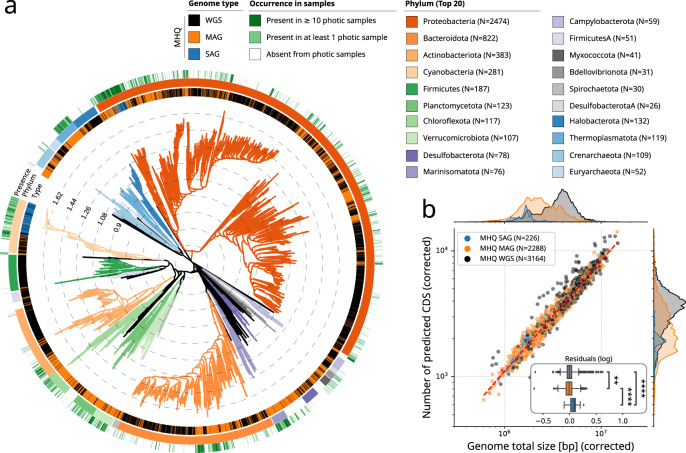
Fig. 1. A database of marine bacterial and archaeal genomes from isolates and uncultivated genomes reconstructed from marine metagenomes.
a Phylogenetic tree of the database of marine genomes (N = 7658) dereplicated at species level (95% Average Nucleotide Identity or ANI). Reference genomes (WGS) were obtained from MarRef, MarDB, and aquatic progenomes, while Metagenome-Assembled Genomes (MAGs) and Single-Amplified Genomes (SAGs) were also obtained from different studies (see “Methods”). A total of 107 phyla (including unclassified) were detected (the top 20 most represented phyla are highlighted). b A comparison of genome size and number of predicted CDS, both corrected by genome completeness (division by completeness), revealed that a genome scaling law is conserved for High and Medium-High Quality (HQ and MHQ) genomes (completeness ≥75% and contamination ≤5%), and that MAGs overall displayed significantly smaller genomes (p = 5.58 × 10 − 194, two-sided Mann–Whitney U test on log-transformed distributions). The box extends from the lower to upper quartile values of the data (Q1 and Q3), with a line at the median (Q2). The whiskers extend from the box to show the range of the data and are defined as follows: where IQR is the interquartile range (Q3-Q1), the upper whisker will extend to last data point less than Q3 + 1.5 × IQR. Similarly, the lower whisker will extend to the first data point greater than Q1–1.5 × IQR. Beyond the whiskers, data are plotted as individual points.

