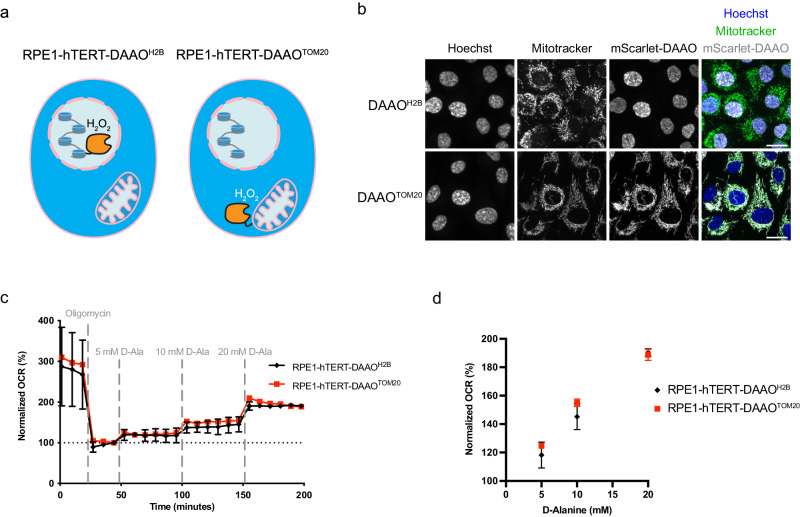
Fig. 1. Localized expression of DAAO enables intracellular H2O2 production.
a Schematic representation of RPE1hTERT cells expressing H2B-mScarlet-I-DAAO or TOM20-mScarlet-I-DAAO (further described as DAAOH2B and DAAOTOM20 respectively) to induce localized intracellular H2O2 production. b Immunofluorescence confocal images of cell lines depicted in (a) showing colocalization of DAAOH2B and DNA (Hoechst), and colocalization of DAAOTOM20 with mitochondria (MitoTracker Green). Scale bar = 20 μm. c Oxygen consumption rate (OCR) upon D-Ala administration as a readout for enzymatic activity of ectopically expressed DAAO. The increase in OCR shows that both lines produce roughly similar amounts of H2O2 upon addition of D-Ala. Data is normalized to OCR upon Oligomycin addition, at the last timepoint before D-Ala injection. The experiment was repeated at least 3 times with reproducible results, 1 biological repeat is depicted. Data are presented as mean values of 5 separate wells -/+ SD. Source data are provided in the Source Data file. d Normalized OCR values from (c) plotted versus [D-ala]. The 6th timepoint after each D-ala injection was used for this graph. Data are presented as mean values -/+ SD. Source data are provided in the Source Data file.

