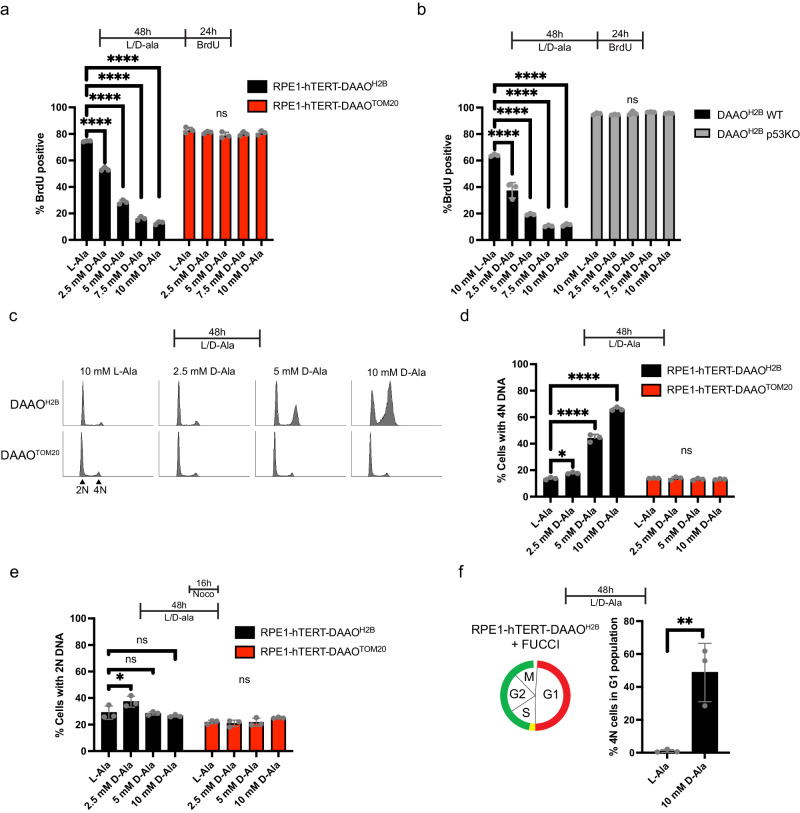
Fig. 4. Nuclear H2O2 production causes a tetraploid, p53-dependent cell cycle arrest, while mitochondrial H2O2 release does not.
a Quantification of the BrdU-incorporation assay. N = 3 biological replicates ~10.000 cells were analyzed per condition in each replicate. Data are presented as mean values -/+ SD. Statistical significance was determined by one-way ANOVA + Dunnett’s multiple comparison test (****p ≤ 0.0001). Source data are provided in the Source Data file. b Same setup as in a, but comparing RPE1-hTERT-DAAOH2B WT cells with p53KO cells. N = 3 biological replicates ~ 10.000 cells were analyzed in each replicate per condition. Data are presented as mean values -/+ SD. Statistical significance was determined by one-way ANOVA + Dunnett’s multiple comparison test (****p ≤ 0.0001). Source data are provided in the Source Data file. c Cell cycle profile analysis of RPE1-hTERT-DAAOH2B and RPE1-hTERT-DAAOTOM20 cells. d Quantification of (c), showing the percentage of cells with a 4 N DNA content. Dots represent 3 biological replicates ~ 10.000 cells were analyzed in each replicate per condition. Data are presented as mean values -/+ SD. Statistical significance was determined by one-way ANOVA test + Dunnett’s multiple comparison test (**p ≤ 0.01, ****p ≤ 0.0001, DAAOH2B 2.5 mM D-Ala = 0.0367, 5 mM D-Ala & 10 mM D-Ala ≤ 0.0001). Source data are provided in the Source Data file. e Quantification of cell cycle profiles of nocodazole treated cells. Dots represent 3 biological replicates ~ 10.000 cells were analyzed in each replicate per condition. Data are presented as mean values -/+ SD. Statistical significance was determined by one-way ANOVA test + Dunnett’s multiple comparison test (*p ≤ 0.05, DAAOH2B 2.5 mM D-Ala = 0.0399). Source data are provided in the Source Data file. f Quantification of cell cycle profiles of RPE1-hTERT-DAAOH2B cells containing the FUCCI cell cycle indicator. Dots represent 3 biological replicates ~ 10.000 cells were analyzed per replicate per condition. Data are presented as mean -/+ SD. Statistical significance was determined by a two-sided unpaired t-test (**p ≤ 0.01, L-ala vs. D-Ala = 0.0097). Source data are provided in the Source Data file.

