
Figure 2. Directed Acyclic Graph for Publication Year, Other Variables, and Missing Visual Elements (MVEs).
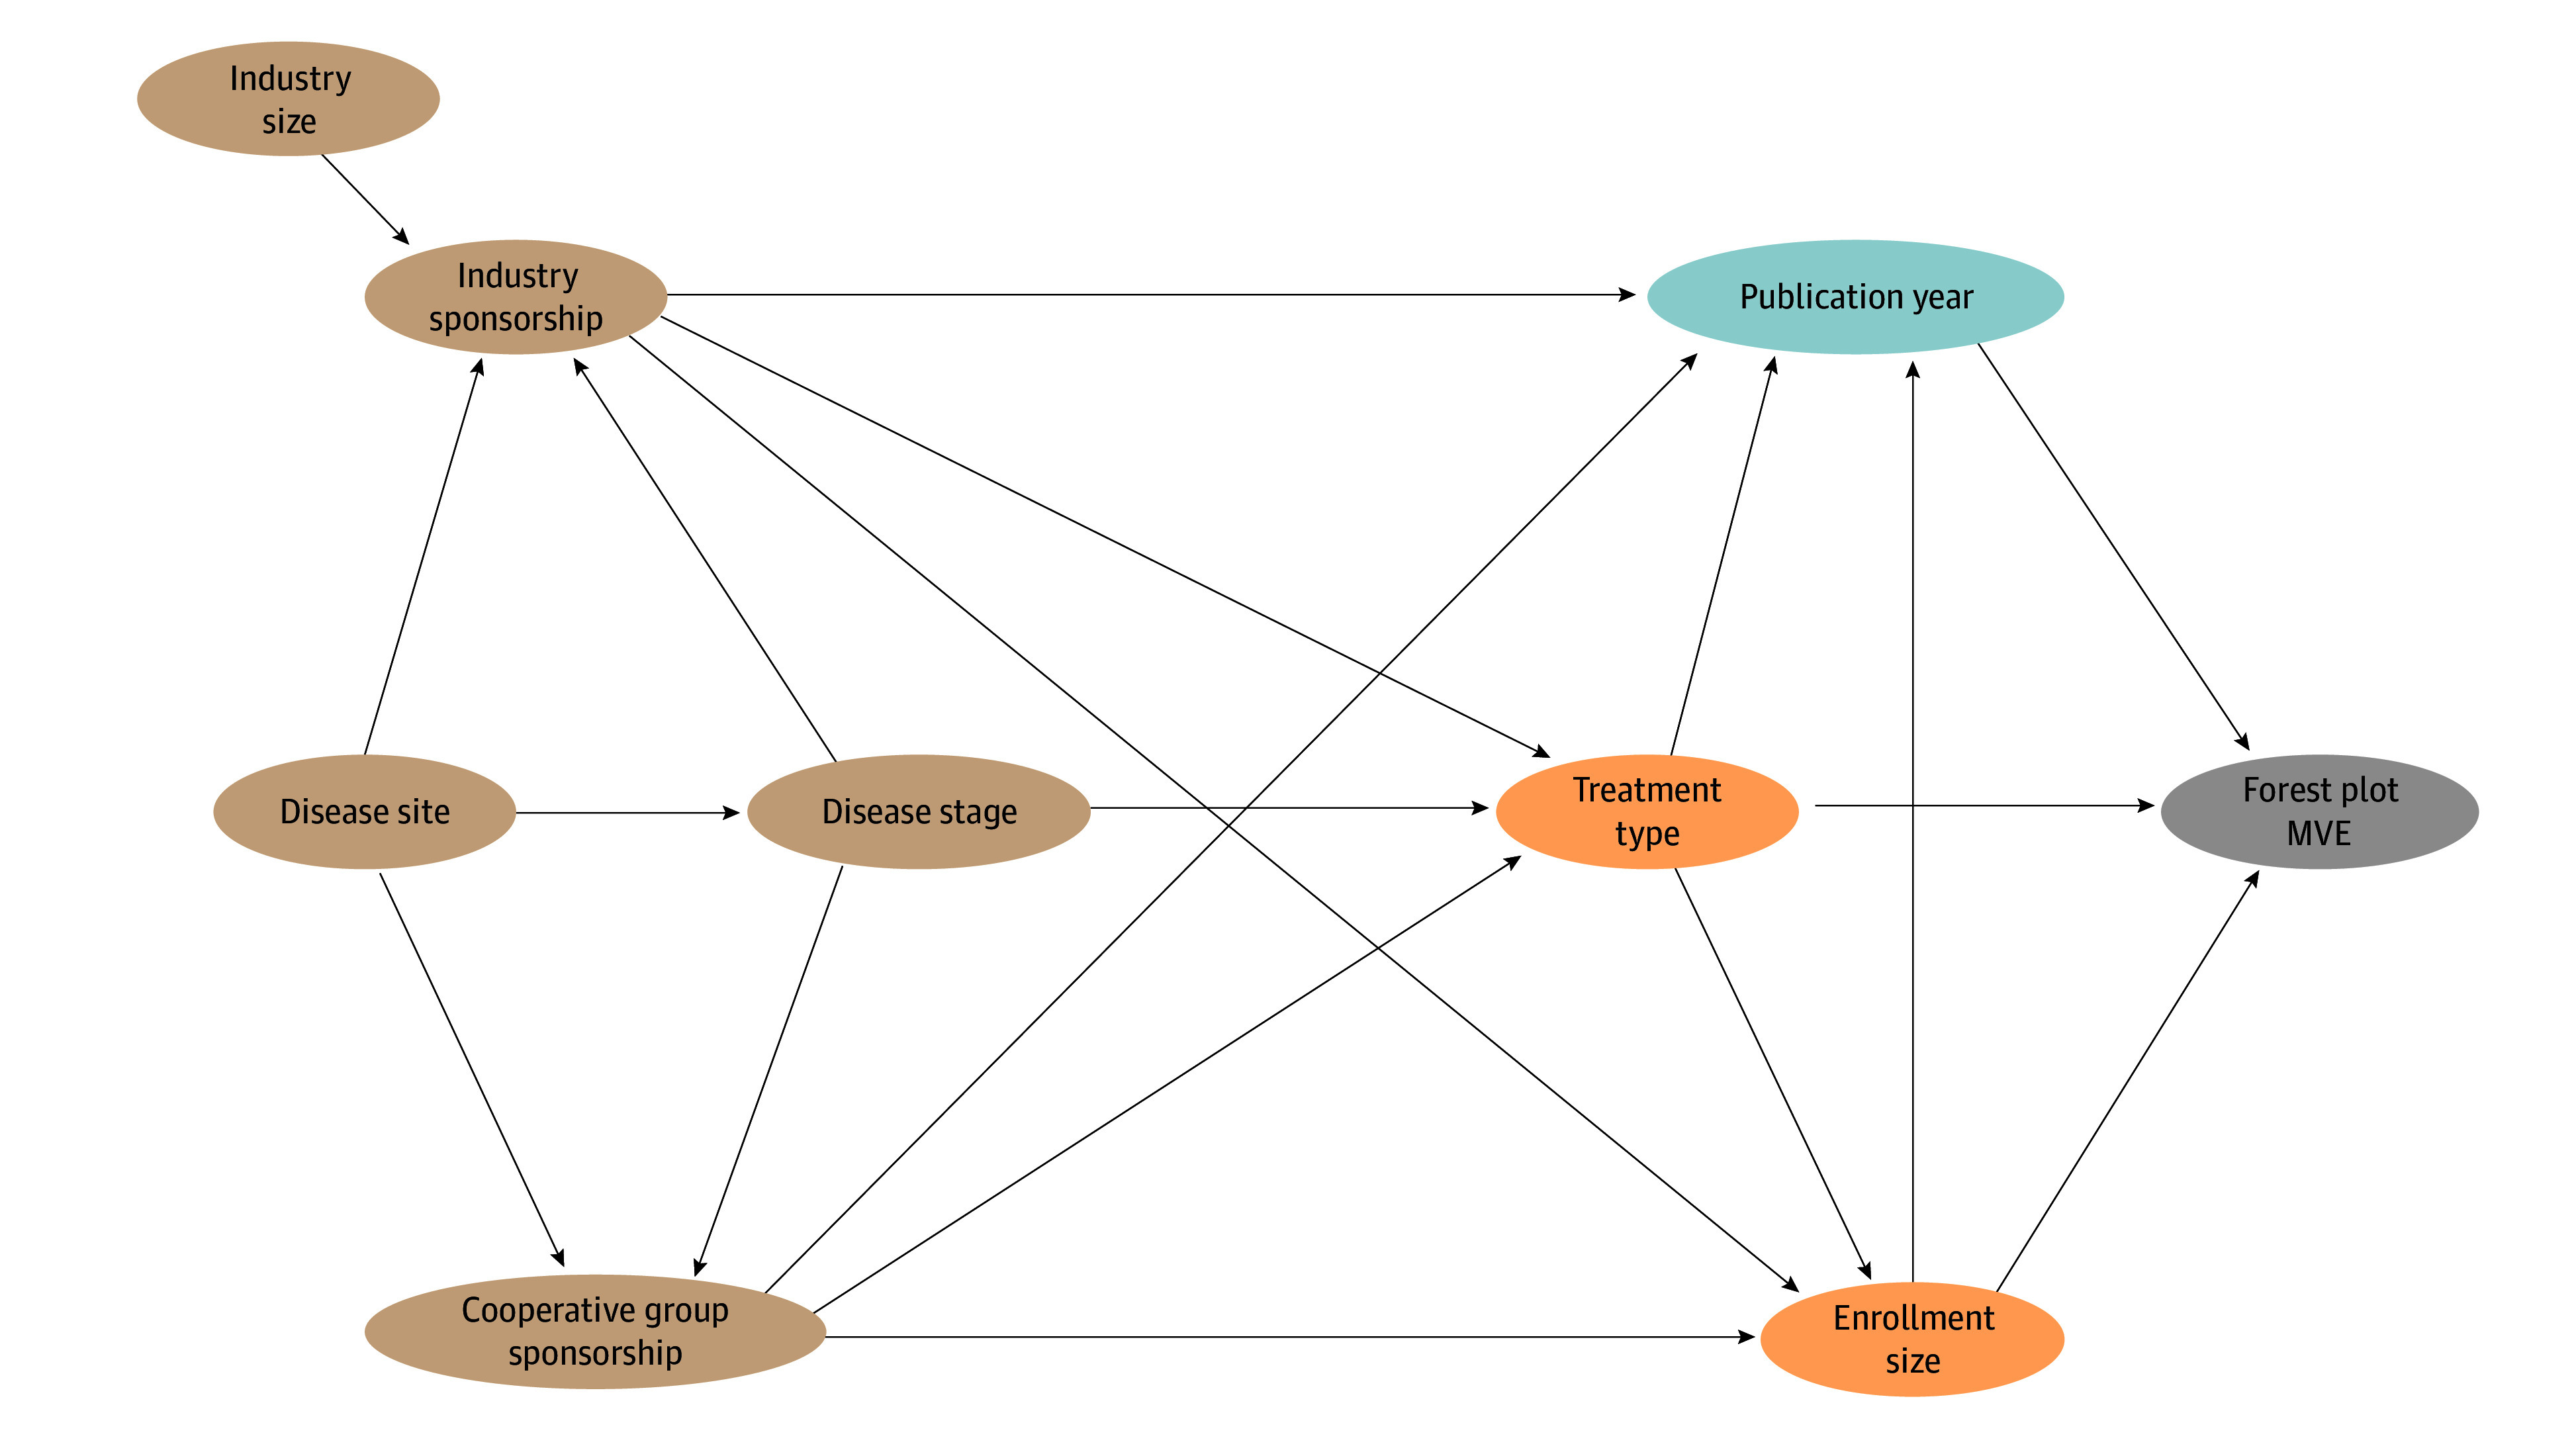
A light blue circle indicates the exposure of interest (publication year), and a gray circle represents the outcome of interest (MVE). Orange circles indicate confounders, and tan circles indicate nonconfounding ancestors of both the factor and outcome.