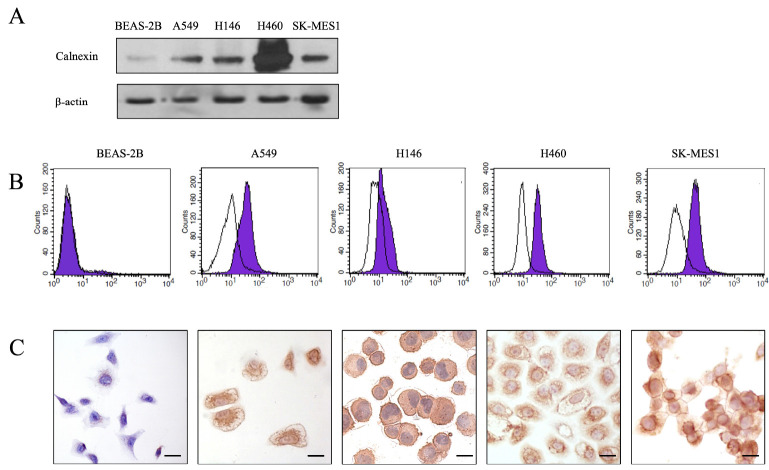
Fig. 1.
Calnexin protein expression in lung cancer cells. (A) Western blot analysis revealing elevated calnexin expression in A549, NCI-H146, NCI-H460, and SK-MES-1 lung cancer cell lines compared to a normal epithelial cell line Beas2B. (B) Flow cytometry histogram showing that the calnexin antibody can strongly bind to the surface of lung cancer cells (purple shaded area) with minimal binding to Beas2B (black curve). The experiment was performed in duplicate at least three times. (C) Lung cancer cells exhibit abundant membrane and ER binding, while Beas2B cells show minimal binding, particularly on the ER (× 400; scale bar, 20 μm).

