
Figure 36.
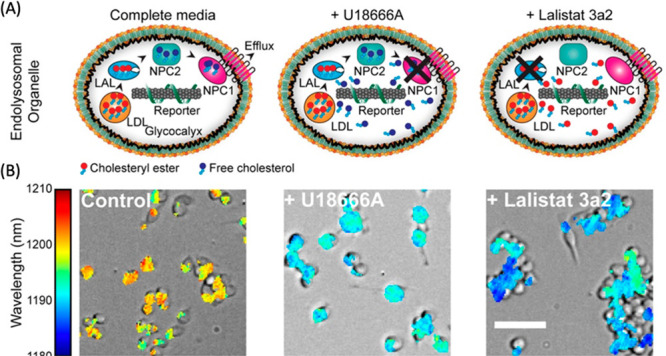
Detection of endolysosomal lipid accumulation in live cells. (A) Schematics of the ss(GT)6-(8,6) SWCNTs in macrophages treated with compounds that accumulate lipids in cells (U18666A or Lalistat 3a2). (B) Overlay of brightfield and hyperspectral images of macrophages incubated with sensors under the specified treatments. Color legend maps to nanotube emission peak wavelength. Scale bar = 50 μm. Adapted from ref (1132). Copyright 2017 American Chemical Society.