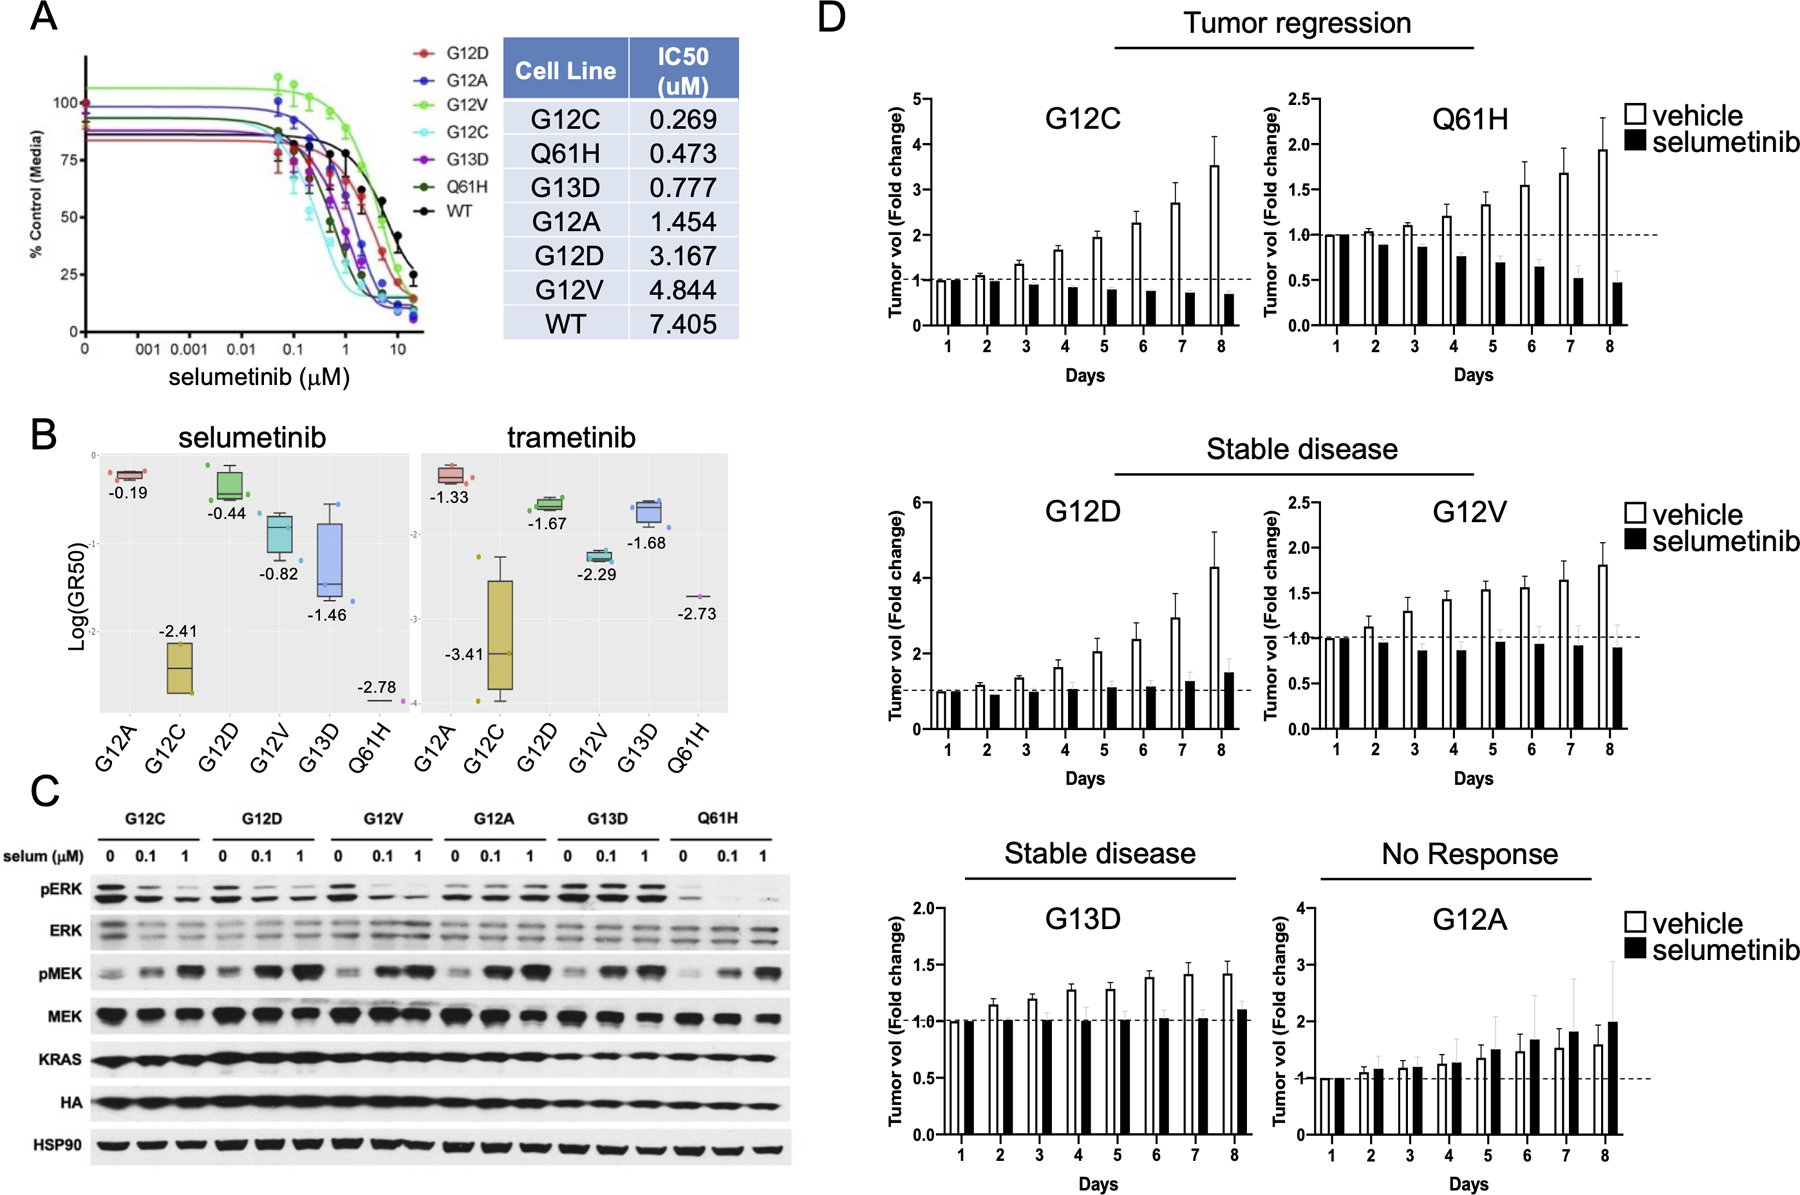
Figure 2:

(A) Comparison of IC50 values to MEK inhibitor selumetinib between KRaslox KRASMUT cells expressing different KRAS isoforms. Error bars represent mean ± SD. Results are representative of one of three similar experiments. The table indicates cell lines ranked by IC50 values (lowest to highest). (B) Log GR50 values for selumetinib and trametinib are shown in the box plot. The numbers and vertical lines go through each box indicate the median. (C) KRaslox KRASMUT cells were seeded and treated with the indicated concentrations of selumetinib for 12 hours and then probed by Western Blot with the indicated antibodies. Results are representative of one of three similar experiments. (D) KRaslox KRASMUT cells (2×10⁶) were injected subcutaneously with Matrigel (1:1) into nude mice. Mice with palpable tumors were randomized into two cohorts (n=6) and treated with vehicle or selumetinib (50mg/kg) daily by oral gavage for one week. Tumor size was measured every day with a caliper. Mean fold change in tumor volume relative to initial tumor volume is shown. Error bars represent mean ± SD.
