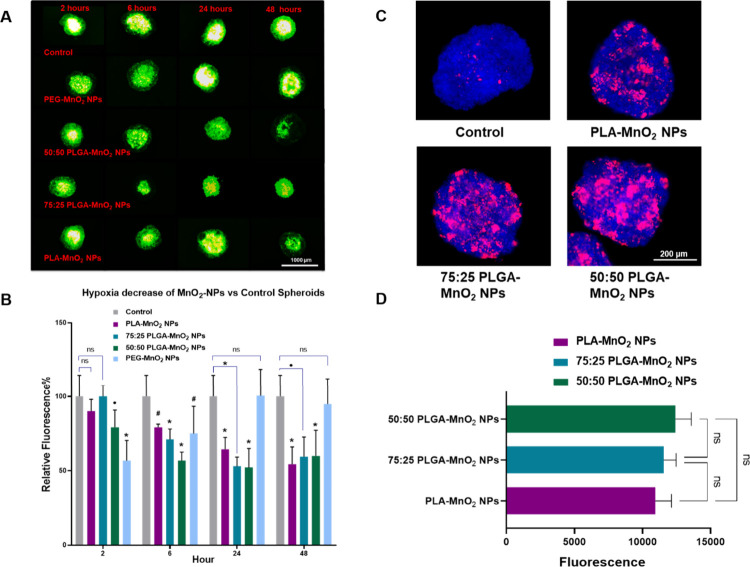
Figure 4.
Effects of NPs on MCF-7 spheroids. (A) Representative images of hypoxia levels in PEG-MnO2 NPs, 50:50 PLGA-MnO2 NPs, 75:25 PLGA-MnO2 NPs, and PLA-MnO2 NPs treated spheroids measured by hypoxia-sensitive dye ImageIT. (B) Quantification of ImageIT signal by ImageJ in NP-treated spheroids to measure extent of hypoxia reduction. Representative image (C) and quantification (D) of NP uptake in spheroids after 24 h exposure. Spheroids were fixed and washed prior to imaging using confocal microscopy. Comparisons that are statistically significant are annotated as *P < 0.001, #P < 0.01, •P < 0.05, and ns = no statistical significance.

