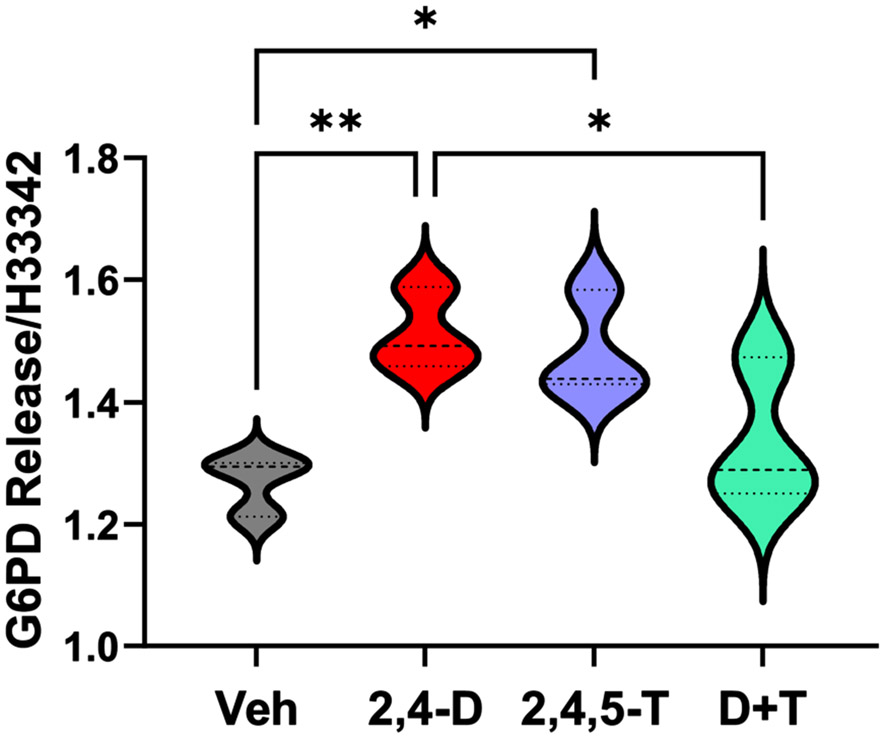
Fig. 4.
Cytotoxicity Assay Results. Culture supernatants from rat FLSCs treated for 24 h with Vehicle (Veh), 2,4-D, 2,4,5-T, or D + T were analyzed for G6PD release using the CyQuant Cytotoxicity Assay. Results were normalized to cellular content using H33342 fluorescence. Violin plots display data from 4 replicate cultures per group with each culture containing 4 or 5 frontal lobe slices (250 μm thick). Intergroup comparisons were made by one-way ANOVA (see Table 3) with post hoc multiple comparison Tukey tests. Significant differences are displayed (*p < 0.05; **p < 0.01).

