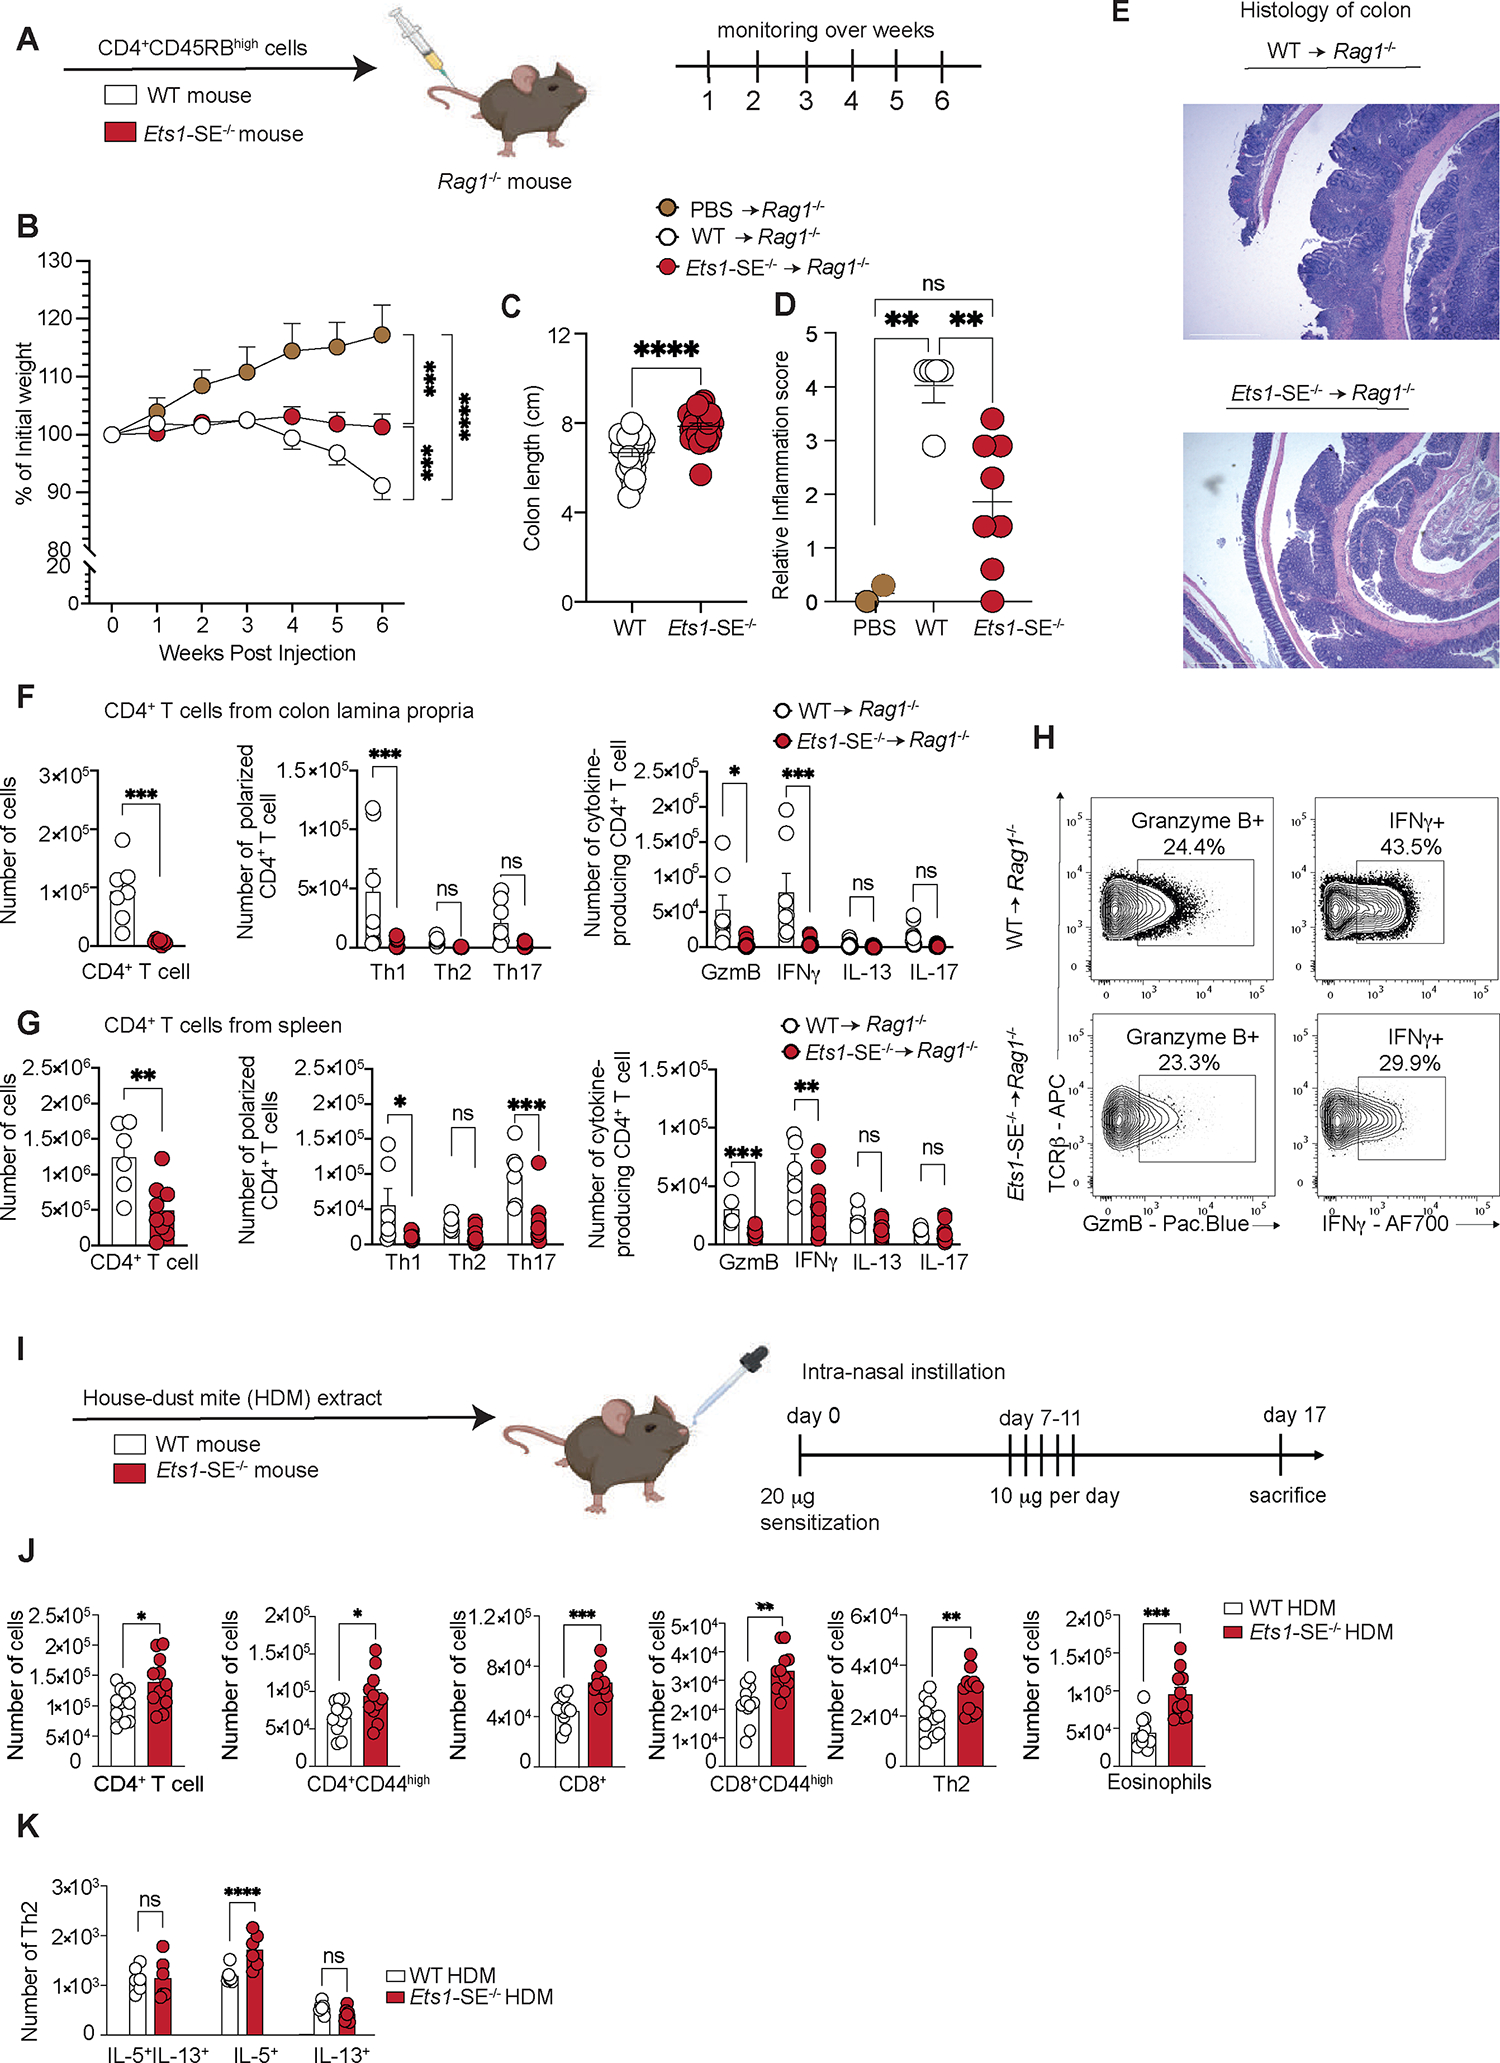
Figure 3: Ets1-SE deletion limits Th1-mediated inflammation in vivo.

A, Schematic representation of the CD45RBHigh-induced colitis model. 1×10⁶ FACS sorted TCRβ+, CD4+, CD45RBHigh naïve CD4+ T cells from wildtype or Ets1-SE−/− were transferred into Rag1−/− recipients to induce colitis.
B, Weight loss tracking of Rag1−/− mice as compared to PBS-injected animals (controls) during 6 weeks post transfer. Three independent experiments were pooled and repeated four times. Dots represent the mean of individual mouse (PBS -> Rag1−/−; n= 5; wildtype -> Rag1−/−; n=25 and Ets1-SE−/− -> Rag1−/−; n=27). Error bars = SEM; and P: ns = not significant, * = P≤0.05, ** = P≤0.01, *** = P≤0.0005, **** = P≤0.0001 (Two-way ANOVA; Mixed-effect REML model with Fisher’s LSD Test).
C, Quantification of colon length (cm) of Rag1−/− mice that received either 1×10⁶ FACS sorted TCRβ+, CD4+, CD45RBHigh naïve wildtype or Ets1-SE−/− CD4+ T cells at week 6 post transfer. Three independent experiments were pooled and repeated four times. Dots represent the mean of individual mouse (wildtype -> Rag1−/−; n=25 and Ets1-SE−/− -> Rag1−/−; n=27). Error bars = SEM; and P: ns = not significant, * = P ≤0.05, ** = P ≤0.01, *** = P ≤0.0005, **** = P ≤0.0001 (Mann-Whitney U Test).
D, E Quantification of the histological score of paraffin-embedded colon rolls from Rag1−/− mice that received 1×10⁶ FACS sorted TCRβ+, CD4+, CD45RBHigh naïve CD4+ T cells from either wildtype or Ets1-SE−/− mice at week 6 post transfer and as compared to PBS-injected mice (control). Histological sections were obtained from two independent experiments and were scored in a blinded manner. Each dot represents an individual mouse (PBS -> Rag1−/−; n= 2, wildtype -> Rag1−/−; n=5 and Ets1-SE−/− -> Rag1−/−; n=8). Error bars = SEM; and P: ns = not significant, * = P≤0.05, ** = P ≤0.01, *** = P ≤0.0005, **** = P ≤0.0001 (One-way ANOVA with multiple comparisons and Bonferroni correction). E, Histological section of colon rolls stained with H&E of Rag1−/− mice that received either 1×10⁶ FACS sorted TCR+, CD4+, CD45RBHigh naïve wildtype or Ets1-SE−/− CD4+ T cells 6 weeks post transfer. Scale = 100μm; Magnification = 100X.
F, (left) Quantification of infiltrating colon lamina propria (cLP) colitogenic CD4+ T cells of Rag1−/− mice that received either wildtype or Ets1-SE−/− CD4+ T cells. (middle) Quantification of Th1 (T-bet+), Th2 (GATA-3+), Th17 (RORγ-t+) CD4+ T cells among infiltrating cLP CD4+ T cells of Rag1−/− mice that received either wildtype or Ets1-SE−/− CD4+ T cells. (right) Quantification of Th1 (IFNγ+), Th2 (IL-13+), Th17 (IL-17+) and Granzyme B (GzmB+) producing CD4+ T cells among infiltrating cLP CD4+ T cells of Rag1−/− mice that received either wildtype or Ets1-SE−/− CD4+ T cells. Two independent experiments were pooled. Dots represent an individual mouse (Ets1-SE+/+ -> Rag1−/−; n=7 and Ets1-SE−/− -> Rag1−/−; n=7). Error bars = SEM; and P: ns = not significant, * = P ≤0.05, ** = P ≤0.01, *** = P ≤0.0005, **** = P≤0.0001 (CD4+ T cells: Mann-Whitney U Test; Th1/Th2/Th17/Treg and cytokines production: Two-way ANOVA with multiple comparisons and Bonferroni correction).
G, (left) Quantification CD4+ T cells in the spleen of Rag1−/− mice that received wildtype or Ets1-SE−/− CD4+ T cells. (middle) Quantification in the spleen of Th1 (T-bet+), Th2 (GATA-3+), Th17 (RORγ-t+) CD4+ T cells of Rag1−/− mice that received either wildtype or Ets1-SE−/− CD4+ T cells. (right) Quantification of ex vivo stimulated splenic Th1 (IFNγ+), Th2 (IL-13+), Th17 (IL-17+) and Granzyme B (Gzm B+) producing CD4+ T cells of Rag1−/− mice that received either wildtype or Ets1-SE−/− CD4+ T cells. Data represent one experiment which was repeated three times. Dots represent an individual mouse (wildtype -> Rag1−/−; n=7 and Ets1-SE−/− -> Rag1−/−; n=7). Error bars = SEM; and p-values: ns = not significant, * = P≤0.05, ** = P ≤0.01, *** = P ≤0.0005, **** = P ≤0.0001 (CD4+ T cells: Mann-Whitney U Test; Th1/Th2/Th17/Treg and cytokines production: Two-way ANOVA with multiple comparisons and Bonferroni correction).
H, Representative flow cytometry contour plot of Granzyme B- and IFNγ-producing ex vivo stimulated cLP CD4+ T cells of Rag1−/− mice that received either wildtype or Ets1-SE−/− CD4+ T cells.
I, Schematic representation of the house dust mite (HDM) extract challenge. Arrows represent days by which intranasal HDM was administered. Mice were euthanized 16 days after the initial sensitization and immune cell infiltration was checked. Two independent experiments were used to measure immune cell infiltration in the lung parenchyma.
J, Quantification of lung parenchyma infiltrating CD4+ T cells (TCRβ+, CD4+), activated CD4+ T cells (TCRβ+, CD4+, CD44+), CD8+ T cells (TCRβ+, CD8+), activated CD4+ T cells (TCRβ+, CD8+, CD44+), CD4+ Th2 cells (TCRβ+, CD4+, GATA-3+) and eosinophils (MHC-II−, Siglec-F+) from wildtype or Ets1-SE−/− mice 16 days after HDM challenge. Two independent experiments were pooled. Each Dot represents an individual mouse (wildtype n=11 and Ets1-SE−/− n=11). Error bars = SEM; and ns = not significant, * = P ≤0.05, ** = P ≤0.01, *** = P ≤0.0005, **** = P ≤0.0001 (Mann-Whitney).
K, Quantification of Th2 cells numbers from wildtype or Ets1-SE−/− mice producing IL-5, IL-13 or IL-5/IL-13 four hours after PMA and Ionomycin stimulation. Data are representative of one independent experiment and repeated twice. Each dot represents an individual mouse (wildtype n=6 and Ets1-SE−/− n=6). Error bars = SEM; and P: ns = not significant, * = P ≤0.05, ** = P ≤0.01, *** = P ≤0.0005, **** = P ≤0.0001 (Two-way ANOVA with multiple comparison and Bonferroni correction).
