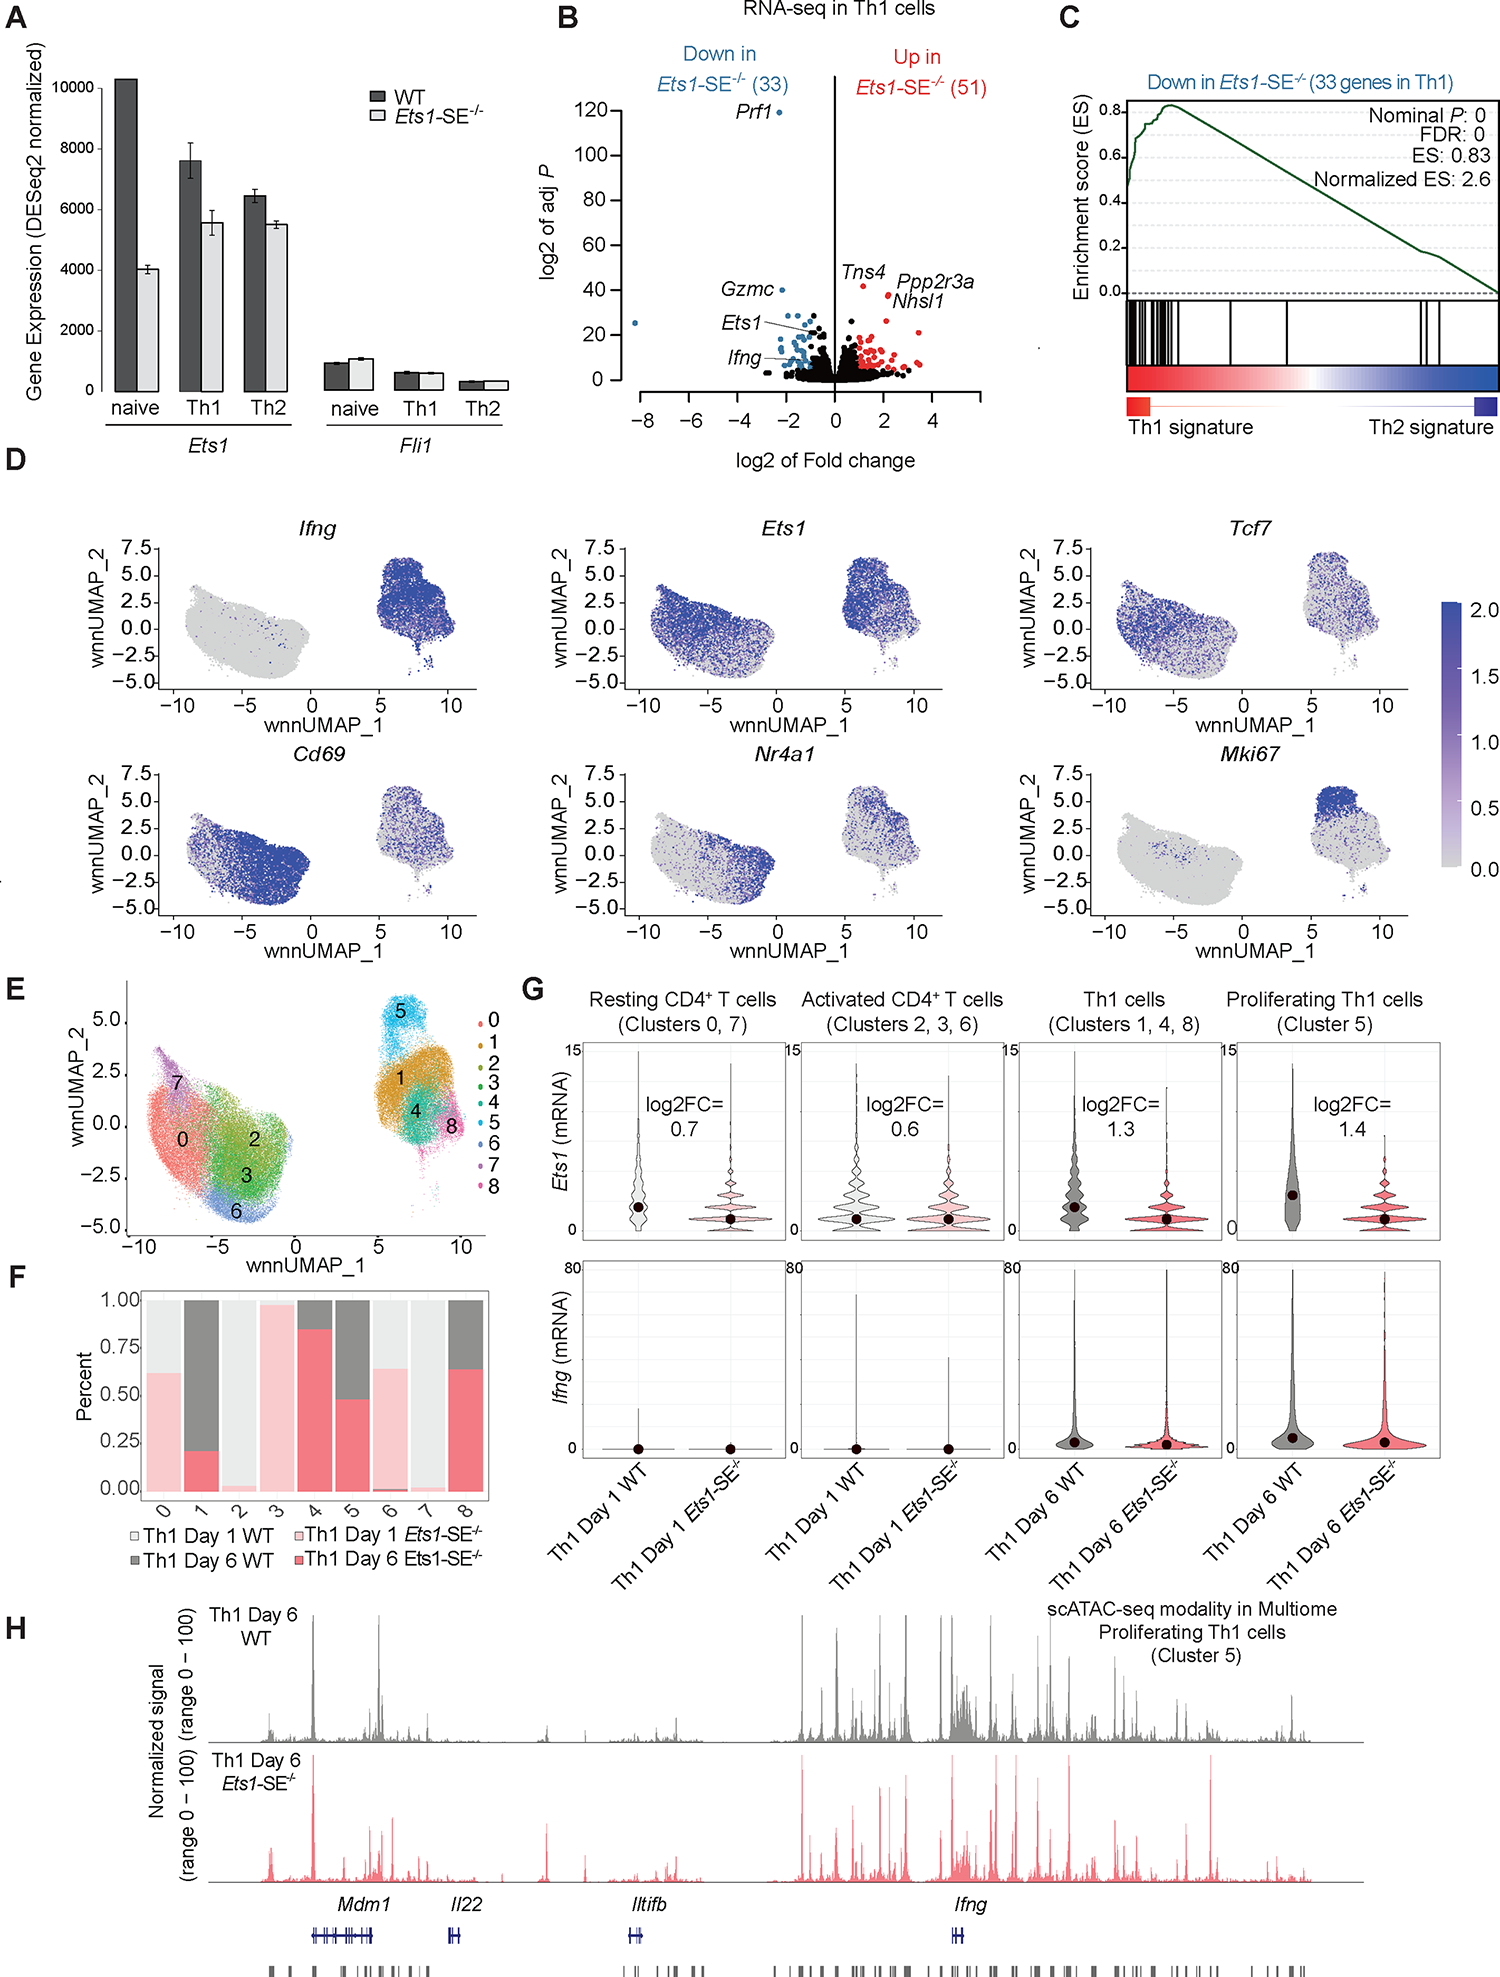
Figure 4. Reorganization of the multi-enhancer hub in the absence of the Ets1-SE element.

A, Barplot demonstrates normalized mRNA levels of Ets1 and Fli1 using bulk RNA-seq experiments in wildtype and Ets1-SE−/− naïve CD4+ and in vitro polarized Th1 and Th2 cells performed in three replicates.
B, Volcano plot demonstrates differential expression analysis of bulk RNA-seq experiments in wildtype and Ets1-SE−/− in vitro Th1 polarized cells studied at day 6. Three replicates were used to perform DESeq2 analysis and |log2FC|>1, adjusted P <0.05 were used to determine differentially expressed genes.
C, Pre-ranked Gene Set Enrichment Analysis (GSEA) depicts the enrichment of gene-set for downregulated genes in Ets1-SE−/− compared with wildtype Th1 cells. The pre-ranked genes were defined based on DESeq2 analysis of wildtype Th1 and Th2 cells.
D,E, Weighted nearest neighbor UMAP (wnnUMAP) projection, which uses both gene expression and chromatin accessibility measurements for dimensionality reduction and clustering of single cell multiomics analysis on wildtype and Ets1-SE−/− day 1 and day 6 Th1 cells using technical replicates, showing mRNA level of Ifng, Ets1, Tcf7, Cd69, Nr4a1, and Mki67 in each cell. e, cluster numbers across wnnUMAP.
F, Barplots showing the composition of each of the 9 clusters including proportion and contribution from each of the four conditions: wildtype and Ets1-SE−/− Th1 after day 1 and day 6 of in vitro cluster. Biological replicates were performed and cells were pooled.
G, Violin plots showing the expression levels of Ets1 and Ifng across individual wildtype and Ets1-SE−/− cells within clusters annotated as resting CD4+ T cells (clusters 0,7), activated CD4+ T cells (clusters 2, 3, 6), Th1 cells (clusters 1, 4, 8) and proliferating Th1 cells (cluster 5).
H, Representative pseudo-bulk ATAC-seq tracks from scATAC-seq modality in multiome of proliferating Th1 cells (cluster 5), showing comparable chromatin accessibility between wildtype and Ets1-SE−/− Th1 cells.
