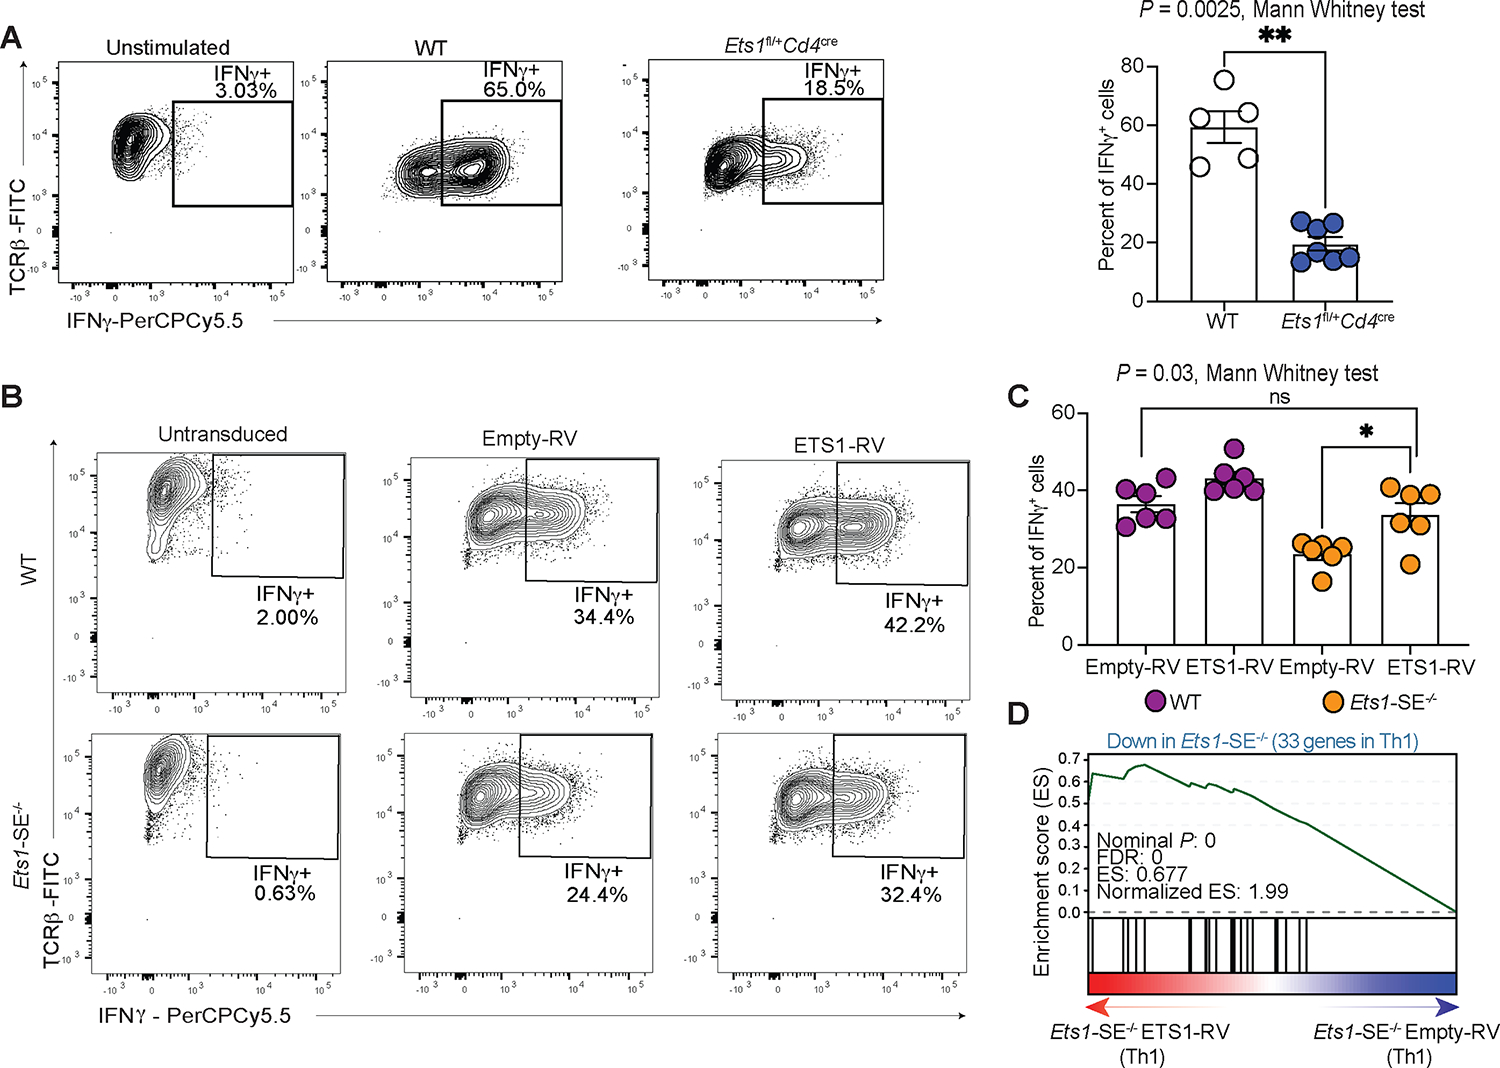
Figure 5: ETS1 dosage controls Th1 differentiation.

A, Flow cytometry results demonstrating frequency of IFNγ expressing cells under unstimulated (left) and in vitro Th1 polarization for 6 days in wildtype (middle) and Ets1 heterozygous mice (Ets1fl/+Cd4cre) (right). The right panel shows bar plot of average results from two independent experiments. Each dot represents an individual mouse. Statistical significance was evaluated using non-parametric Mann-Whitney test. ** P = 0.0025.
B, Flow cytometry results demonstrating frequency of IFNγ expressing cells when naïve CD4+ T cells were retrovirally transduced with empty vector (Empty-RV) or ETS1 expressing vector (ETS1-RV) and were polarized under in vitro Th1-differentiating conditions for 6 days. The panel shows representative contour plots, C, panel shows bar plot of average results from two independent experiments. Each dot represents an individual mouse. Significance was tested using non-parametric Mann-Whitney test. * P = 0.03.
D, Pre-ranked Gene Set Enrichment Analysis (GSEA) depicts the enrichment of the downregulated genes in Ets1-SE−/− compared with wildtype Th1 cells as gene-set. The pre-ranked genes based on DESeq2 analysis of Ets1-SE−/− cells transduced with empty-vector and ETS1-expressing vector. Three technical replicates were used for DESeq2 analysis.
