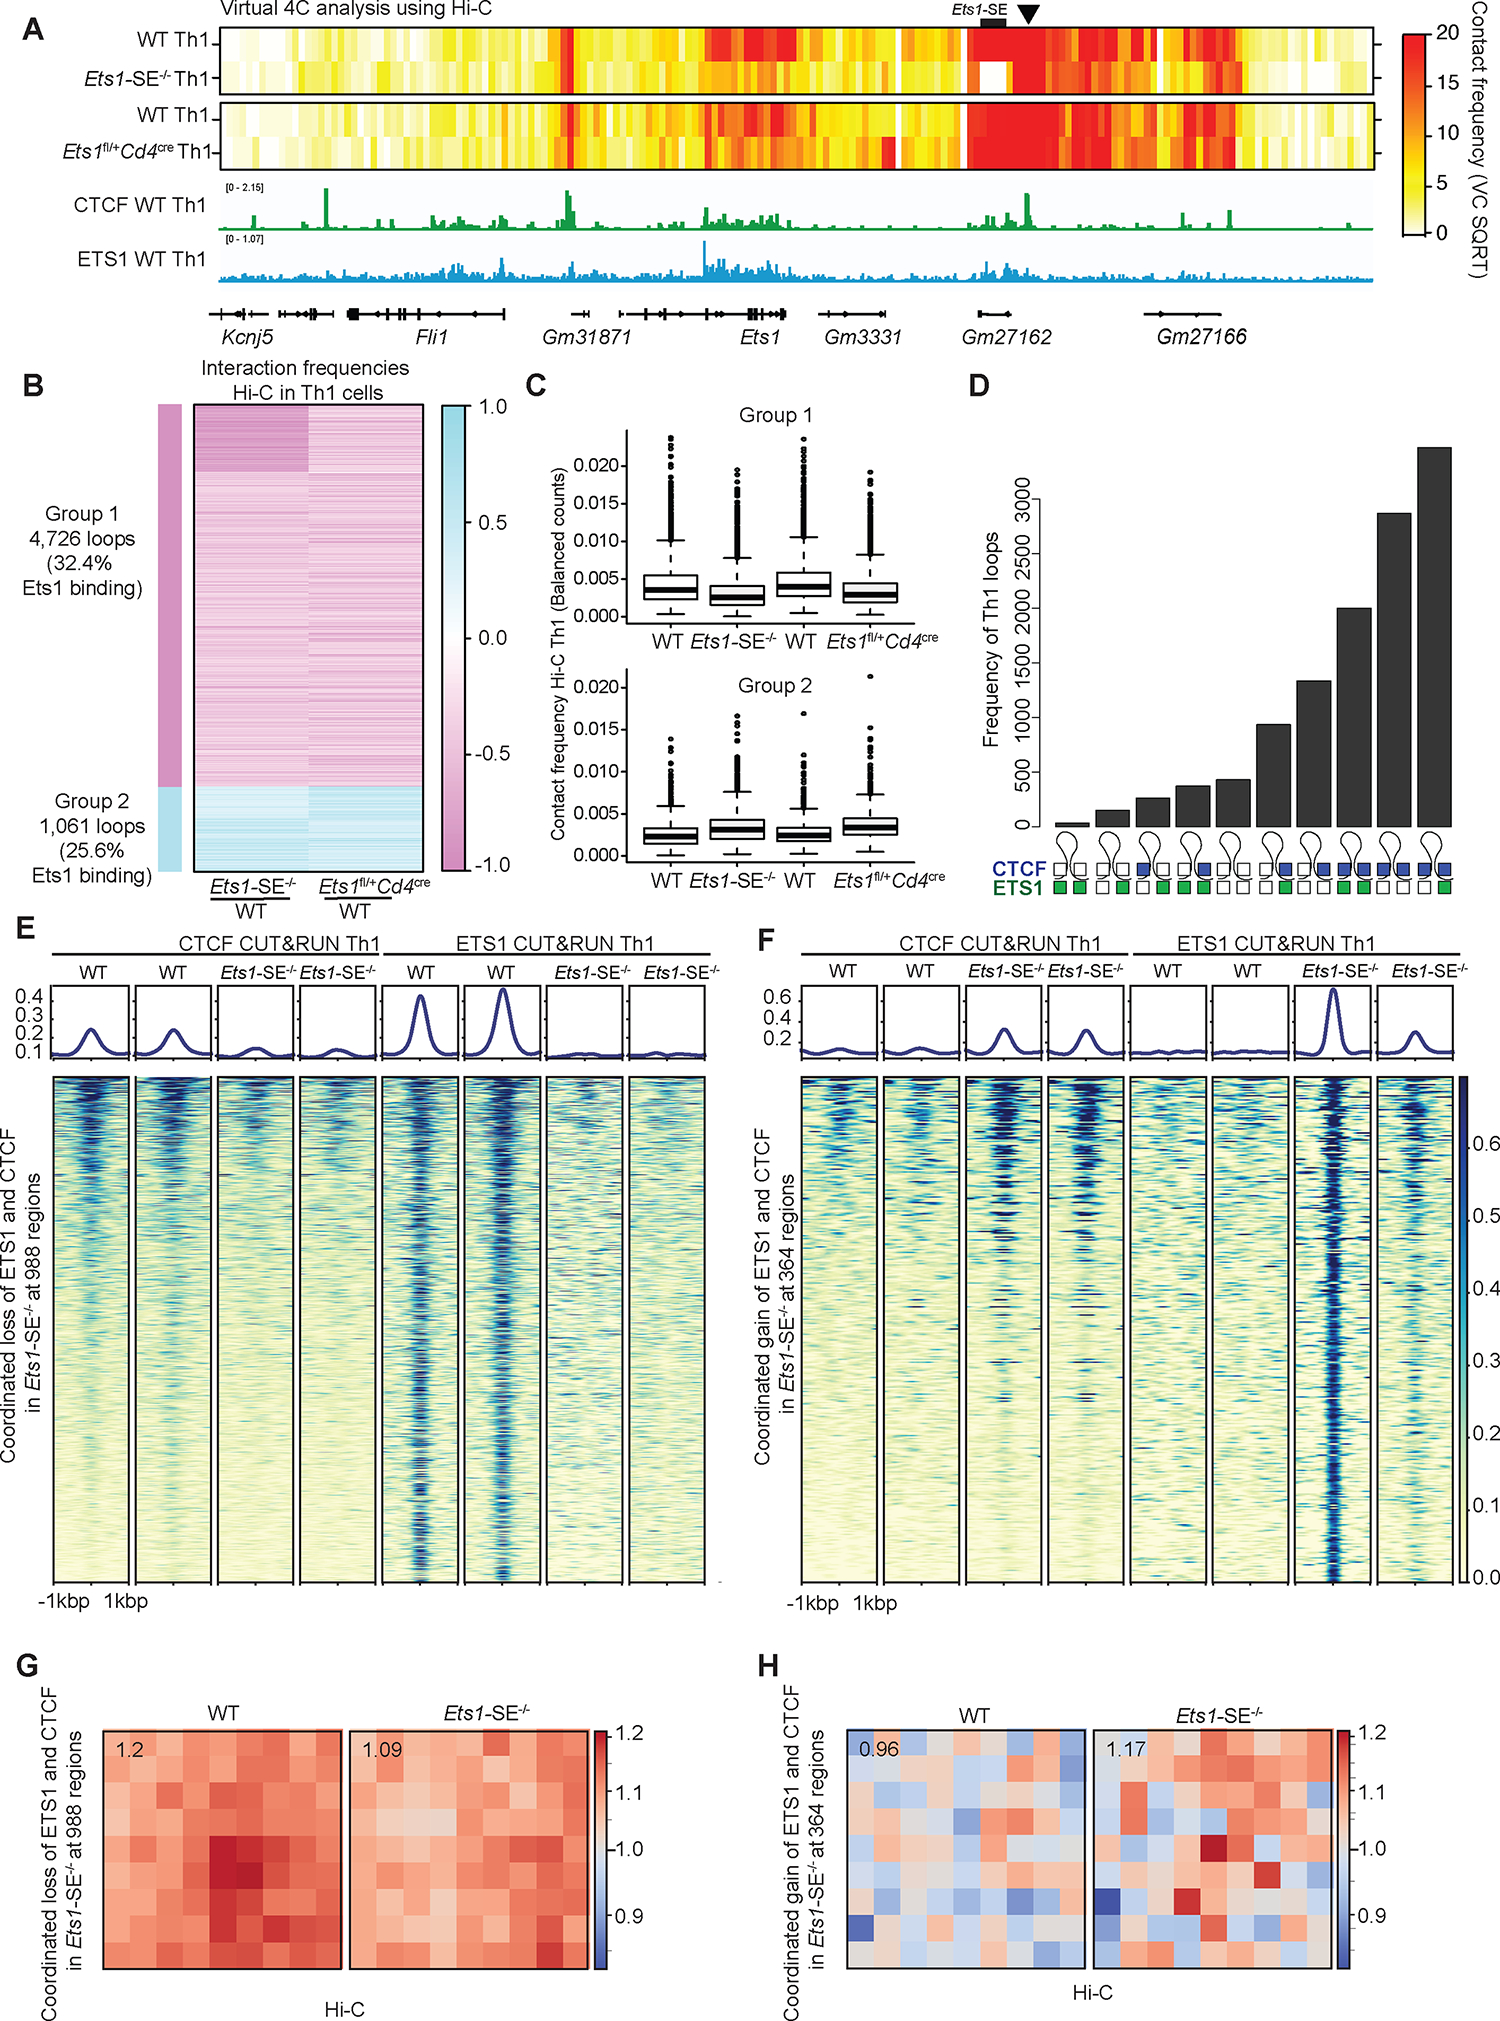
Figure 6: Ets1 level controls the 3D genome topology of Th1 cells in a CTCF-dependent manner.

A, Heatmap of contact frequencies from virtual 4C analysis of Hi-C data generated from wildtype, Ets1-SE−/− and Ets1fl/+Cd4cre Th1 cells, using the immediate downstream locus of Ets1-SE as the 4C-anchor (chr9:32,940,001–32,945,000) (marked with black arrow). The genome browser view of the corresponding locus is shown along with CTCF and ETS1 binding tracks generated from CUT&RUN on wildtype Th1 cells.
B, Heatmap showing log2 fold change in interaction frequencies from Hi-C in Ets1-SE−/− and Ets1fl/+Cd4cre Th1 cells, compared to their respective matched wildtype controls. Group 1 which includes 4,726 loops demonstrates weaker interactions in in Ets1-SE−/− and Ets1fl/+Cd4cre Th1 cells, compared to their respective matched wildtype controls. Group 2 which includes 1,061 loops demonstrates stronger interactions in in Ets1-SE−/− and Ets1fl/+Cd4cre Th1 cells, compared to their respective matched wildtype controls. The percentage of loops with ETS1 binding based on CUT&RUN in wildtype Th1 cells is also provided. Each row represents an individual interaction or a loop.
C, Boxplot showing average interaction frequencies from Hi-C in Ets1-SE−/− and Ets1fl/+Cd4cre Th1 cells, and their respective matched wildtype controls, using group 1 and group 2 loops.
D, UpSet plot demonstrates the number of Th1-associated loops with different binding patterns of CTCF and ETS1 across two loop anchors. A filled square represents bound, and an open square represents no binding. Blue and green squares represent CTCF and ETS1 binding, respectively. Bedtools intersect was used to define overlapping peaks with loop anchors detected in Th1 cells.
E,F, Heatmap demonstrates CTCF and ETS1 occupancy levels at genome regions where both proteins are lost (f) and gained (g) in Ets1-SE−/− compared with wildtype Th1 cells. DESeq2 was used to define co-bound regions by ETS1 and CTCF measured by CUT&RUN with differential occupancy between wildtype and Ets1-SE−/− Th1 cells using P<0.05 & |logFC|>0.5.
G,H, Loop pileups of long-range interactions anchored at genomic regions described in (e) and (f) with lost (g) and gained (h) occupancy generated by coolpuppy. Hi-C data in wildtype and Ets1-SE−/− Th1 cells were used. The number in the top left corner represents the average intensity in 3×3 box at the center.
