
Figure 1. Schema of right eye (RE) and left eye (LE) showing zone borders and clock hour sectors used to describe the location of vascularization and extent of retinopathy.
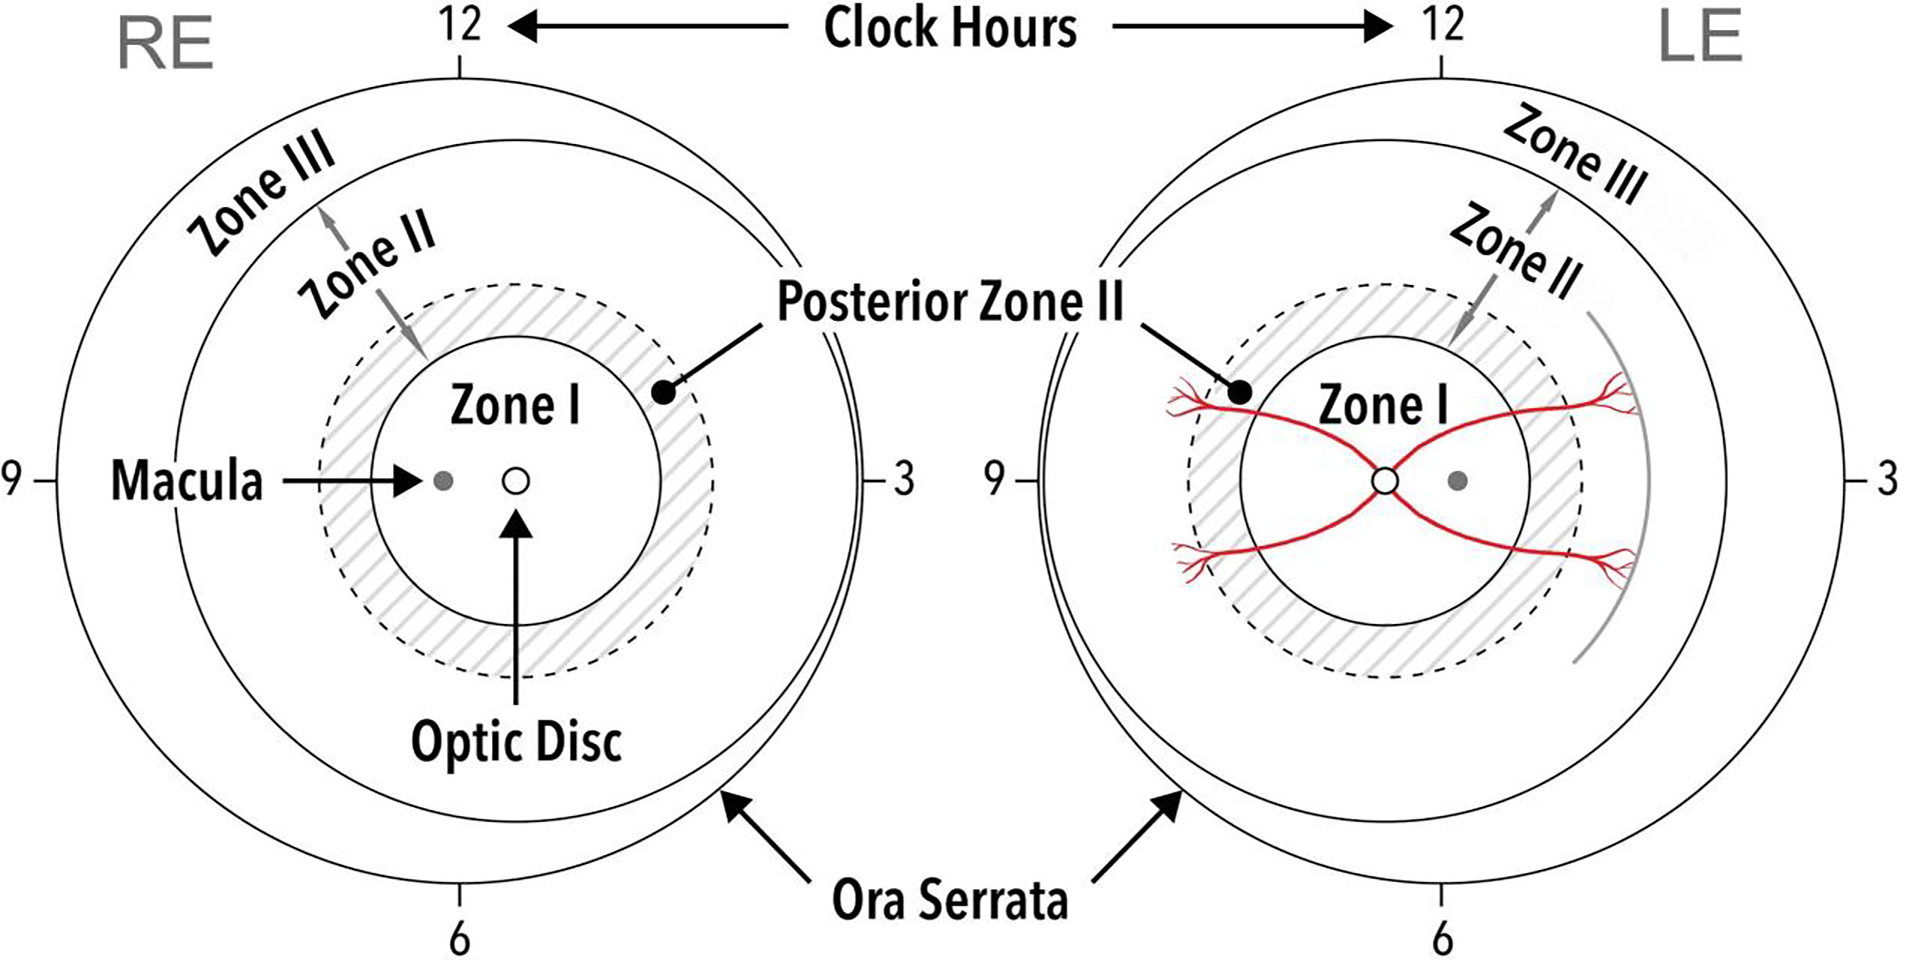
Solid circles represent borders of zones I-III, and dotted circles represent borders of posterior zone II (two disc diameters beyond zone I). A hypothetical example of examination findings is shown in the left eye, representing approximately three clock hours of stage 1 disease in zone II (note single line on drawing to document presence of stage 1 disease).