
Figure 6. Optical coherence tomography (OCT) images demonstrating examples of retinopathy of prematurity stages 1–3.
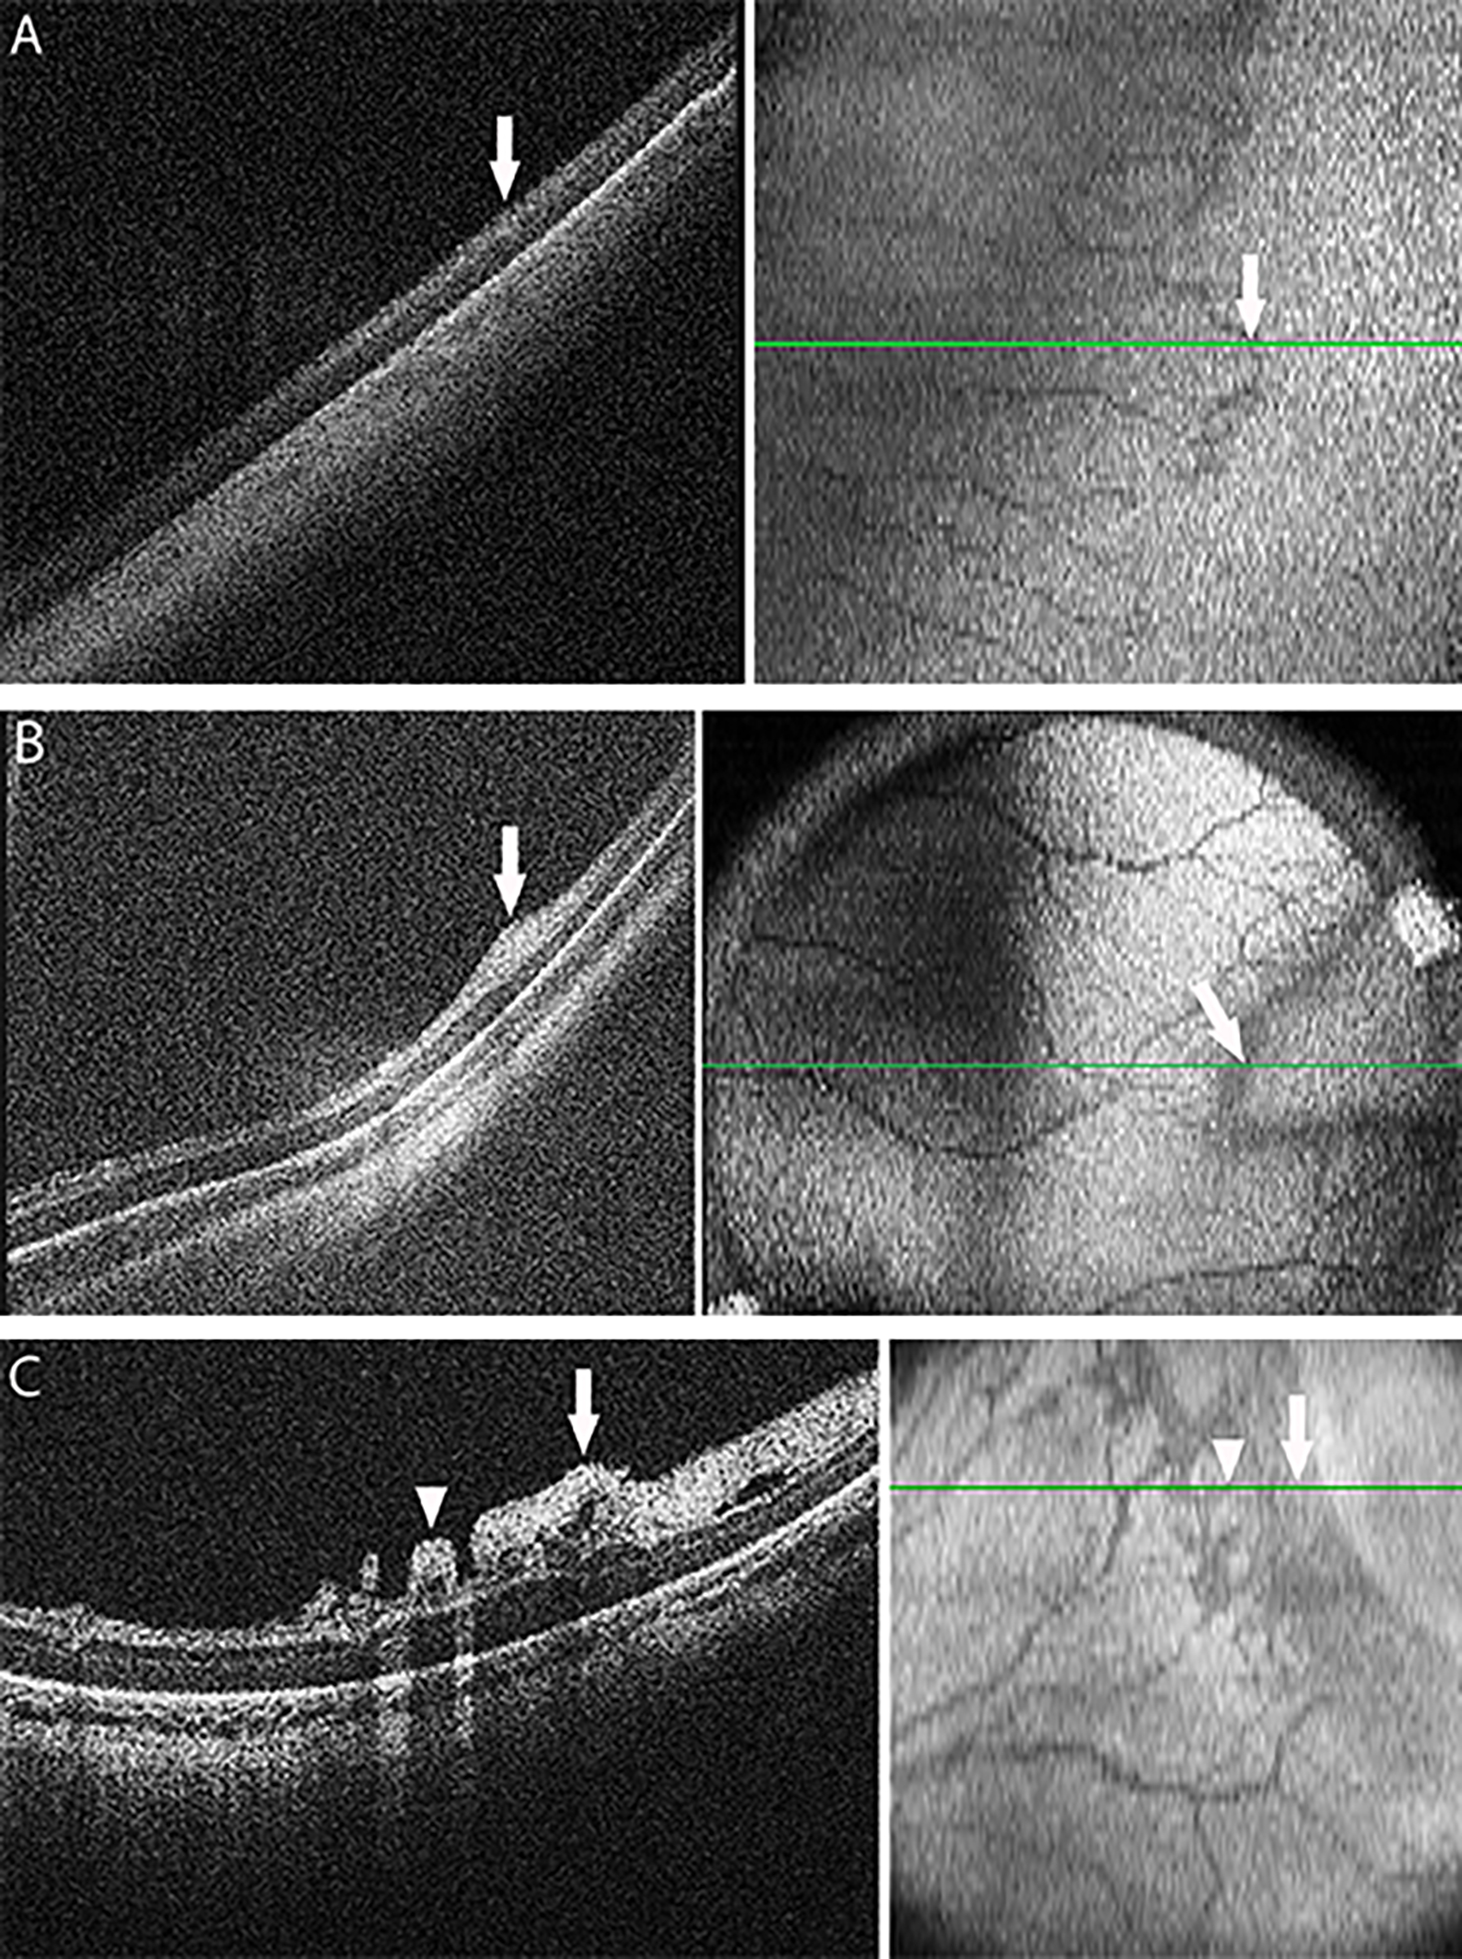
OCT cross-sectional B-scans (left side) are extracted from the raster scans that make up the OCT volume, at the location of the green-line (right side). The en face OCT images (right side) are summed from the OCT volume, and blood in retinal vessels casts a shadow across the underlying retina and choroid. (A) Stage 1 demarcation line (white arrows) on cross-sectional B-scan OCT image (left side) align with the retinal vascular-avascular junction (right side, note the vascular retina is to the left in all images). (B) Stage 2 ridge (white arrows) on cross-sectional B-scan OCT image (left side) at a site of focal thickening and bulge of inner retinal layers, aligns with the en face (right side) wider dark border of the vascular-avascular junction. (C) Stage 3 extraretinal neovascular proliferation at (white arrows) and posterior to (arrowheads) the vascular-avascular junction on cross-sectional B-scan OCT image (left side) and on en face view (right side). Note that blood in the extraretinal vessels also casts a shadow across the underlying retina and choroid.