
Figure 9. Optical coherence tomography (OCT) images demonstrating examples of stage 4 disease.
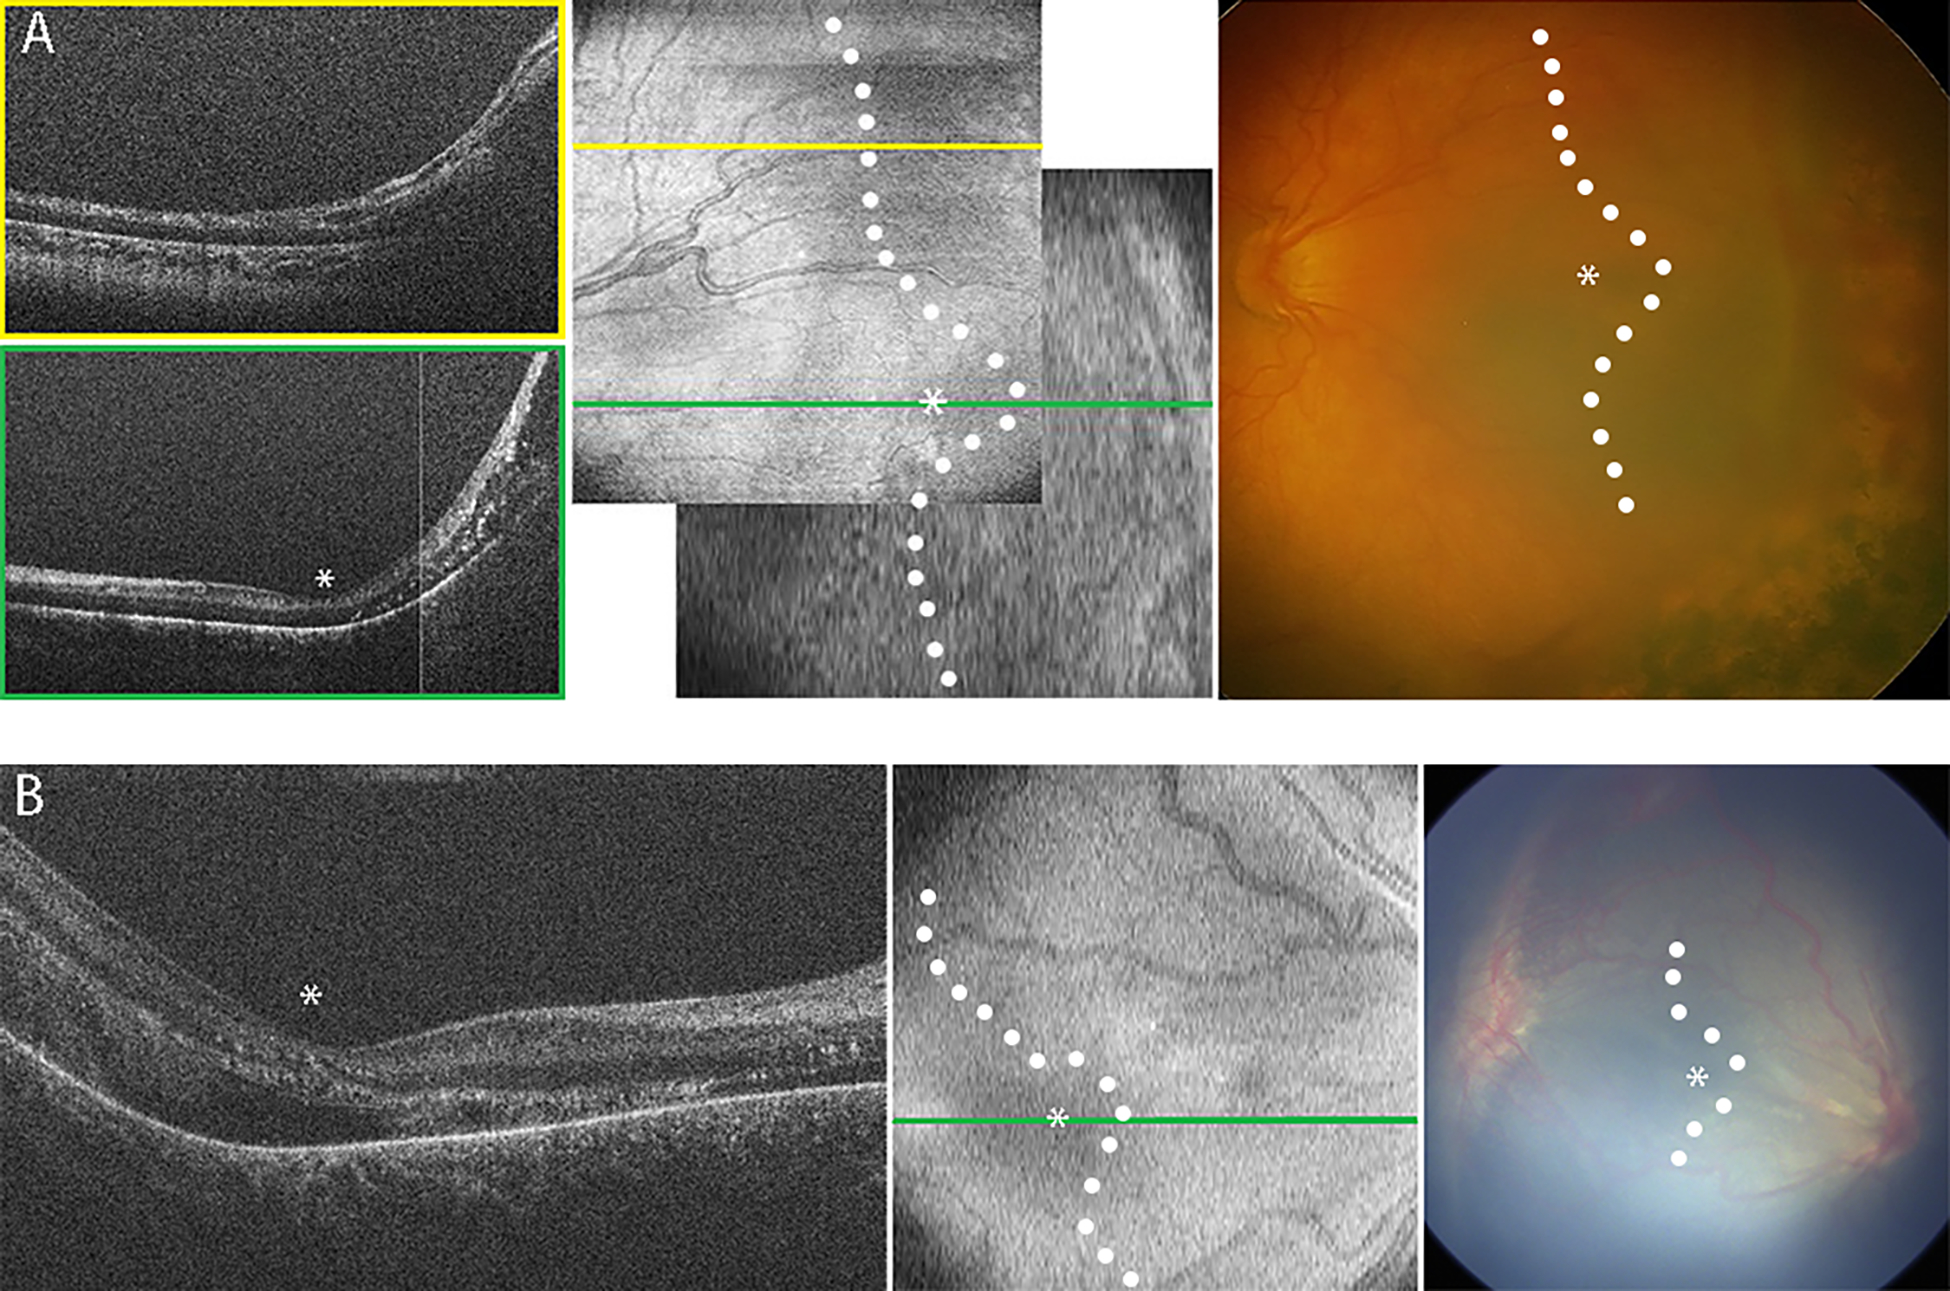
OCT cross-sectional B-scans (left side) are extracted from the raster of scans that make up the OCT volumes, viewed as summed en face (middle) with corresponding color photographs (right side). Note that in the color photographs, it is difficult to discern the extent of retinal detachment, especially foveal involvement. In en face OCT and color photos, the location of the fovea (asterisk) and margin of detachment (white dots) are determined from OCT B-scans. Blood in retinal vessels casts a shadow across the underlying retina and choroid in the en face views. (A) Stage 4A retinal detachment. On the en face OCT image (middle), yellow line demonstrates location of B-scan superior to the foveal center (upper left side, yellow box), green line demonstrates location of B-scan through the foveal center (bottom left side, green box). Note the attached retina on B-scan at the foveal center (asterisk), along with intraretinal exudates (hyperreflective dots), peripheral retinal detachment, and retinoschisis. (B) Stage 4B retinal detachment. Note detachment of retina at the foveal center (asterisks), which was very difficult to appreciate on ophthalmoscopic examination.