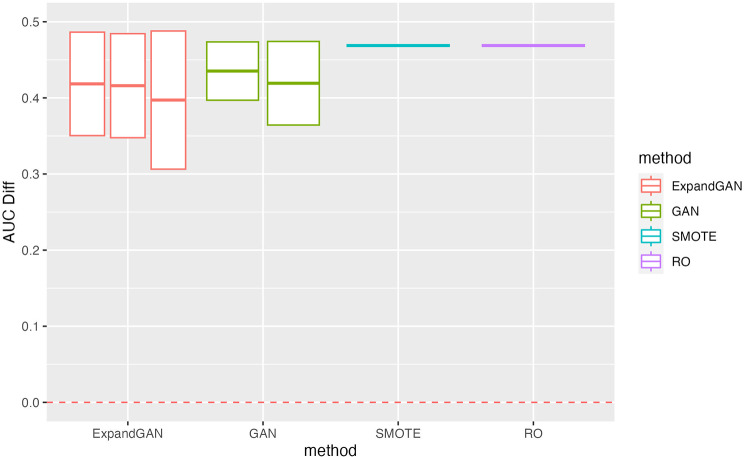
Fig. 6.
Lipidomics Validation Performance. Validation scores are summarised across experiments using the lipidomics data for GAN, ExpandGAN, SMOTE and RO methods. Boxes represent 1 standard deviation from the mean, and the horizontal line, of the box, the mean. The ‘AUC Diff’ defines the score difference between the 0.5 baseline (red, separated lines) and the validation score. Adjacent, same-coloured bars define results using different alpha hyperparameters, in order of 0/0, 1/0, 1/1 for ExpandGAN and 0 and 1 for GAN. Area under the receiver operating characteristic curve (AUC)

