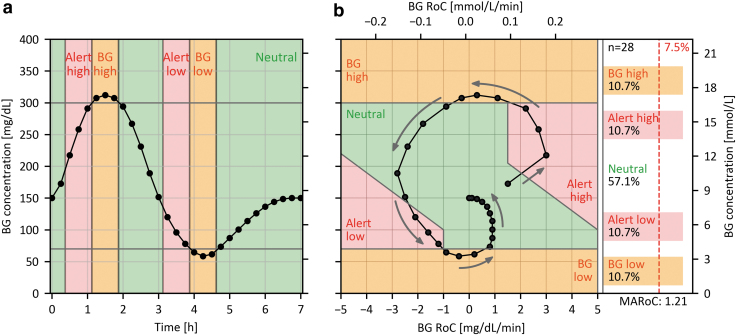
FIG. 2.
(a) Target profile of BG concentrations over time during an in-clinic session. (b) DGR plot showing the associated profile of combined RoC and BG. The gray arrows indicate the direction of the curve with respect to its evolution over time. Note that there is no RoC-BG pair for time zero, because each BG value is paired with an RoC calculated with respect to the preceding BG value. The colored background indicates the critical regions in which adequate CGM accuracy is of particular importance. The panel on the right shows the percentages of RoC-BG pairs in the respective regions, the proposed minimum required percentage for the critical regions (7.5%), the MARoC in mg/(dL·min), and the number of RoC-BG pairs (n = 28). BG, blood glucose; DGR, dynamic glucose region; MARoC, mean absolute RoC; RoC, rate of change.

