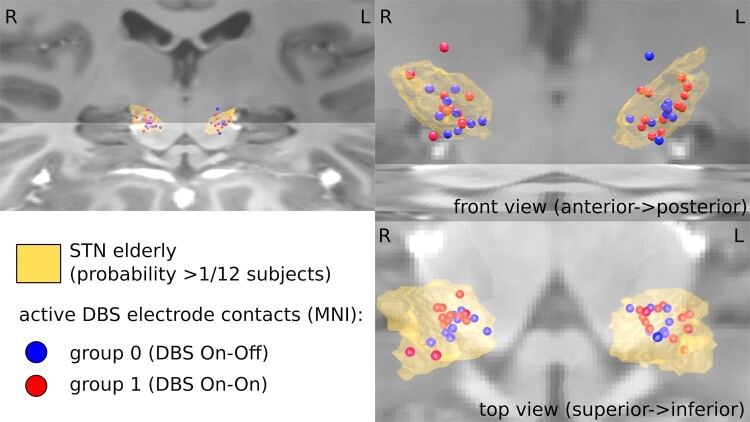
Figure 8.
Electrode location. Demonstration of the electrode position of DBS in the STN level with 3D STN modelling (yellow formation) from different views. Electrodes are shown as circles separated by groups. Comparable positions of the DBS electrodes are shown for the On–On stimulation group (red circles) compared to the On–Off stimulation group (blue circles). Thus, the positioning of the electrodes does not seem to be able to explain the differences between the spatial performances of the groups. The image was created using the Colin Holmes MNI template.47 Image quality was significantly improved after registration, resampling with 0.5 mm3 voxels and averaging (C: 0.78 mm3, n = 7; D: 1.0 mm3, n = 20) in a standard space, allowing delineation of fine structures previously obscured by noise. DBS, deep brain stimulation; STN, subthalamic nucleus; MNI, Montreal Neurological Institute (overview and statistics in Table 1).

