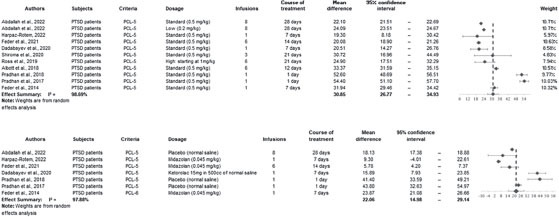
Figure 3.

Forest Plot for Mean Difference in baseline PCL-5 score and at the endpoint ketamine treatment for intervention and control groups, respectively

Forest Plot for Mean Difference in baseline PCL-5 score and at the endpoint ketamine treatment for intervention and control groups, respectively