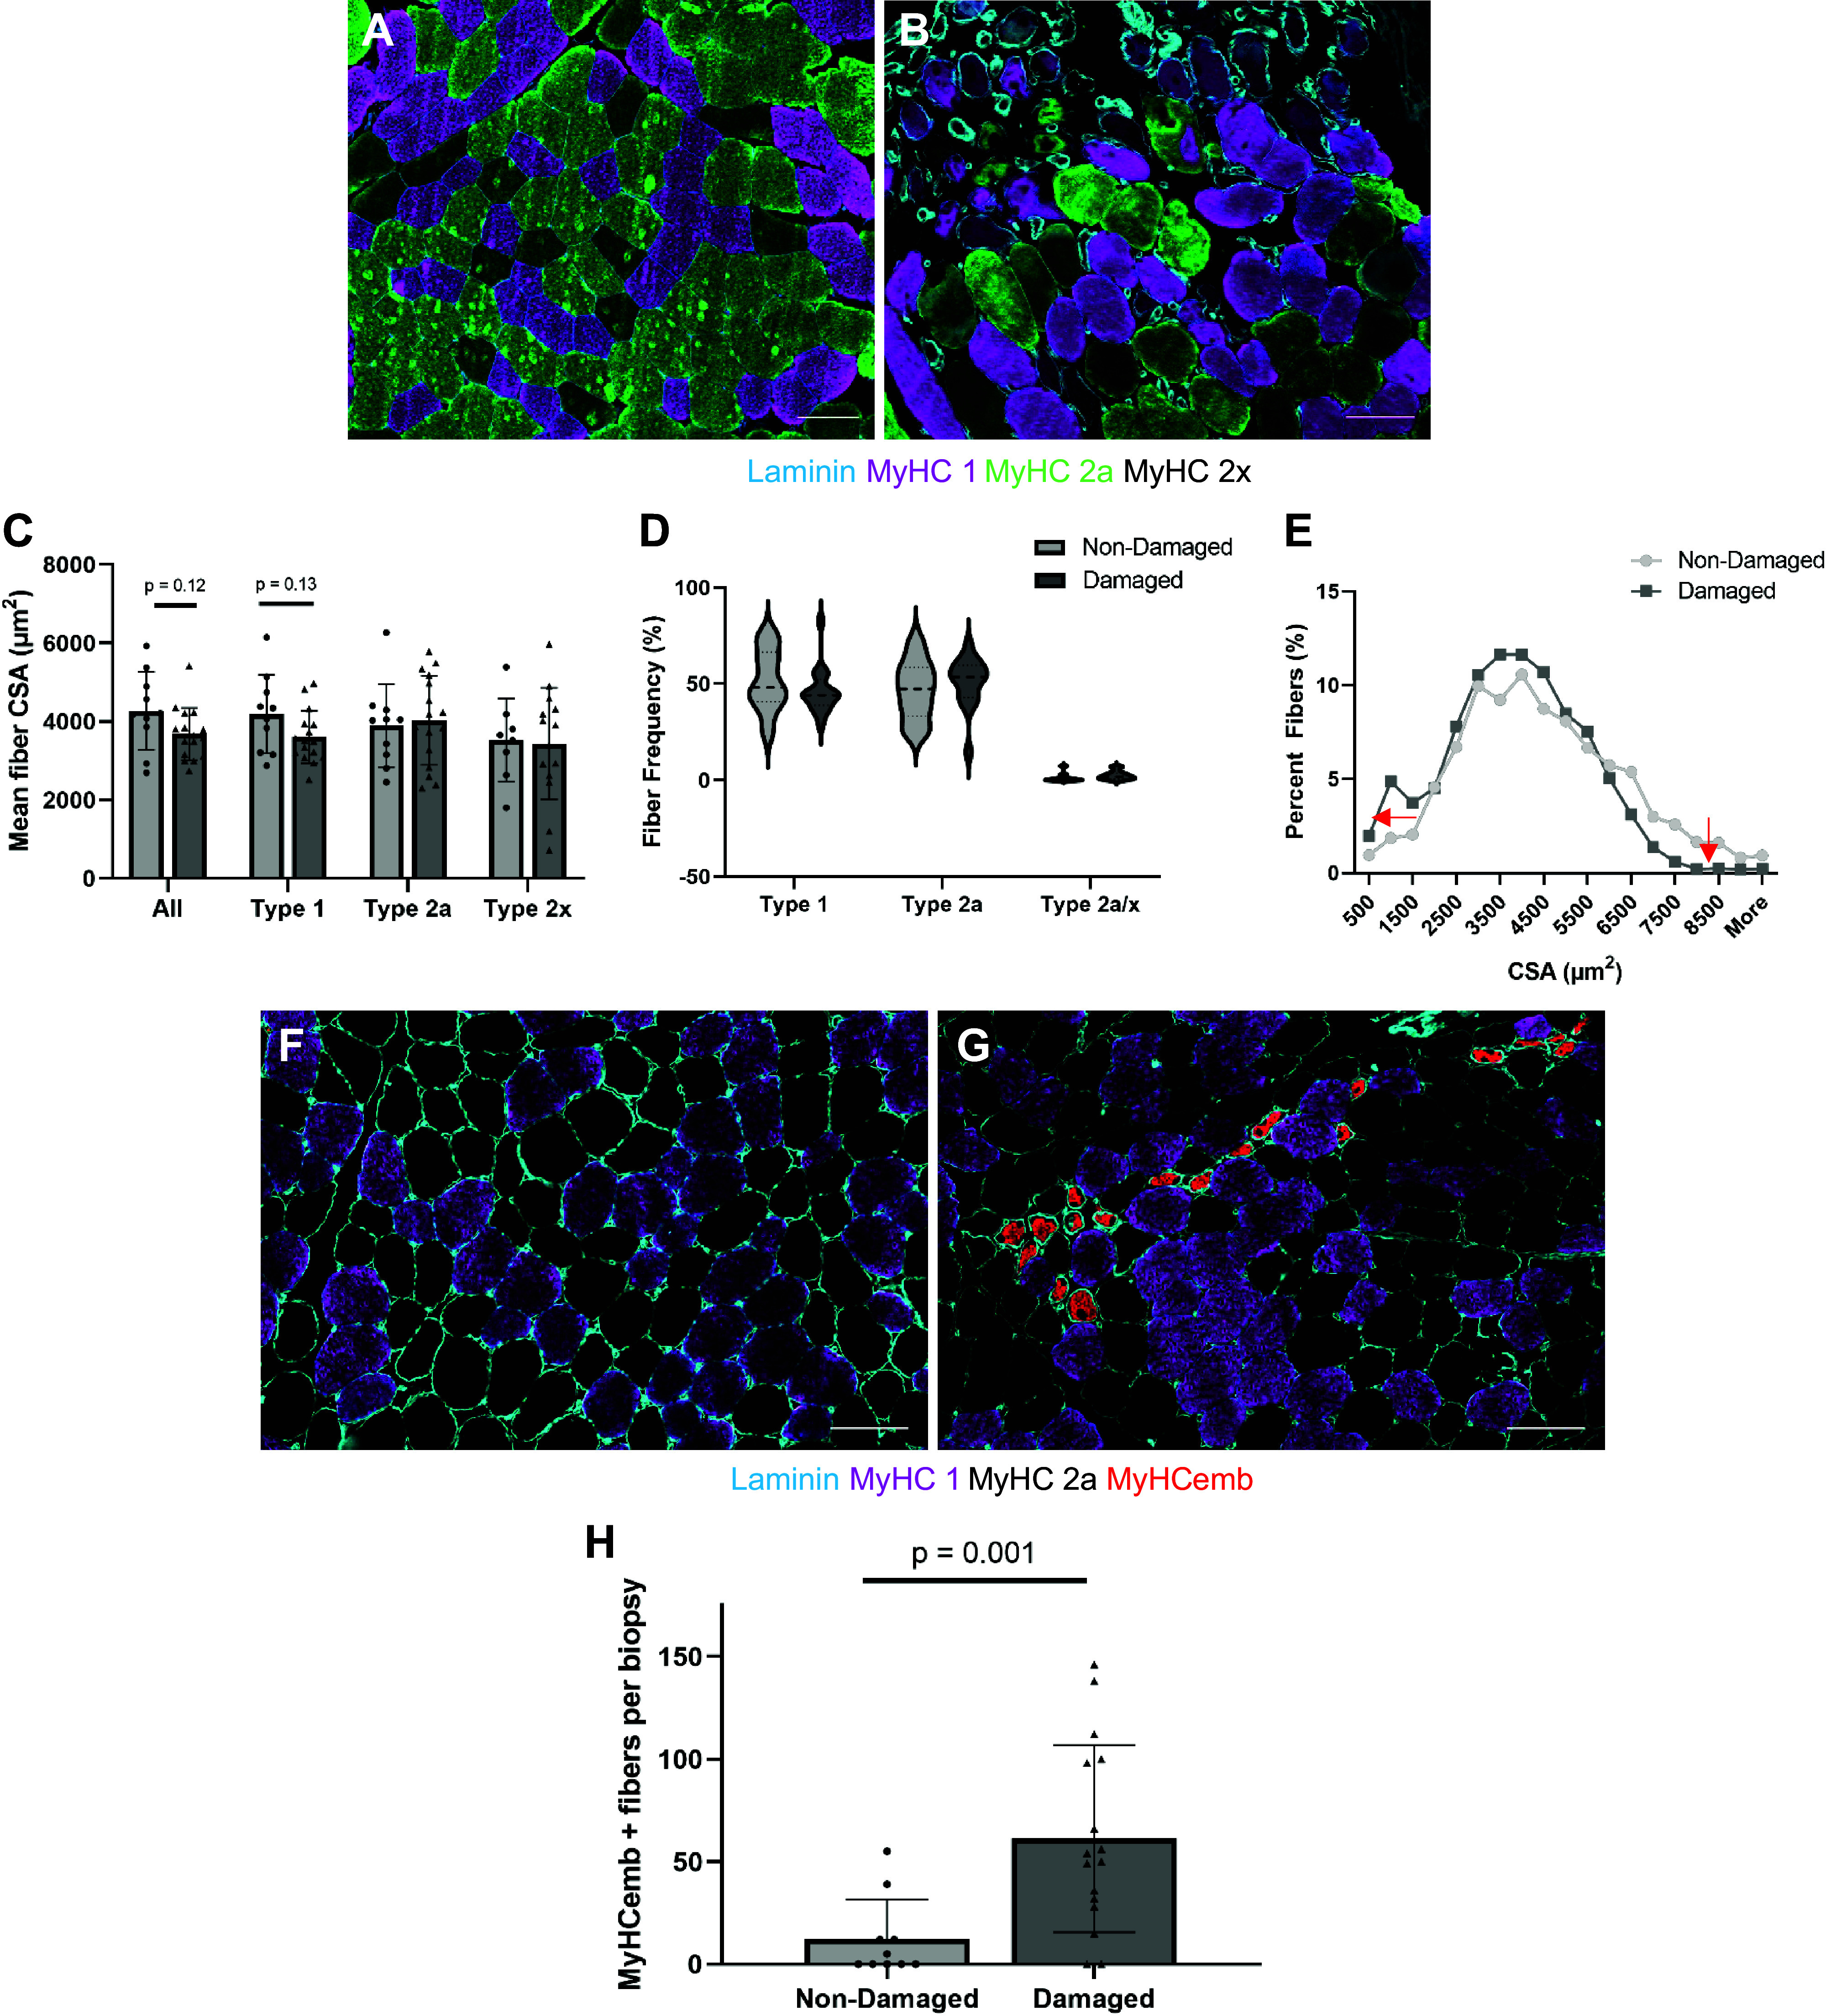
Figure 3.

Differences in myosin heavy chain (MyHC) and cross-sectional area (CSA) between damaged and nondamaged biopsies. Representative images of muscle tissue immunoreacted with MyHC 1 (purple), 2a (green), 2x (black), and laminin (blue) with no signs of damage (A) or with damage/regeneration (B). Mean fiber CSA (C), fiber type frequencies (D), fiber size distribution (E) of nondamaged (n = 10, light gray) and damaged (n = 16, dark gray). Arrows in (E) indicate shift of distribution curve. Representative images of muscle sections with MyHC 1 (purple), 2a (black), and embryonic (red) for nondamaged (F) and damaged (G) groups. Number of embryonic MyHC (MyHCemb)-positive fibers in nondamaged (light gray, n = 10) and damaged (dark gray, n = 16) biopsies (H). Scale bars in all pictures are 100 µm. Values are means ± SD.
