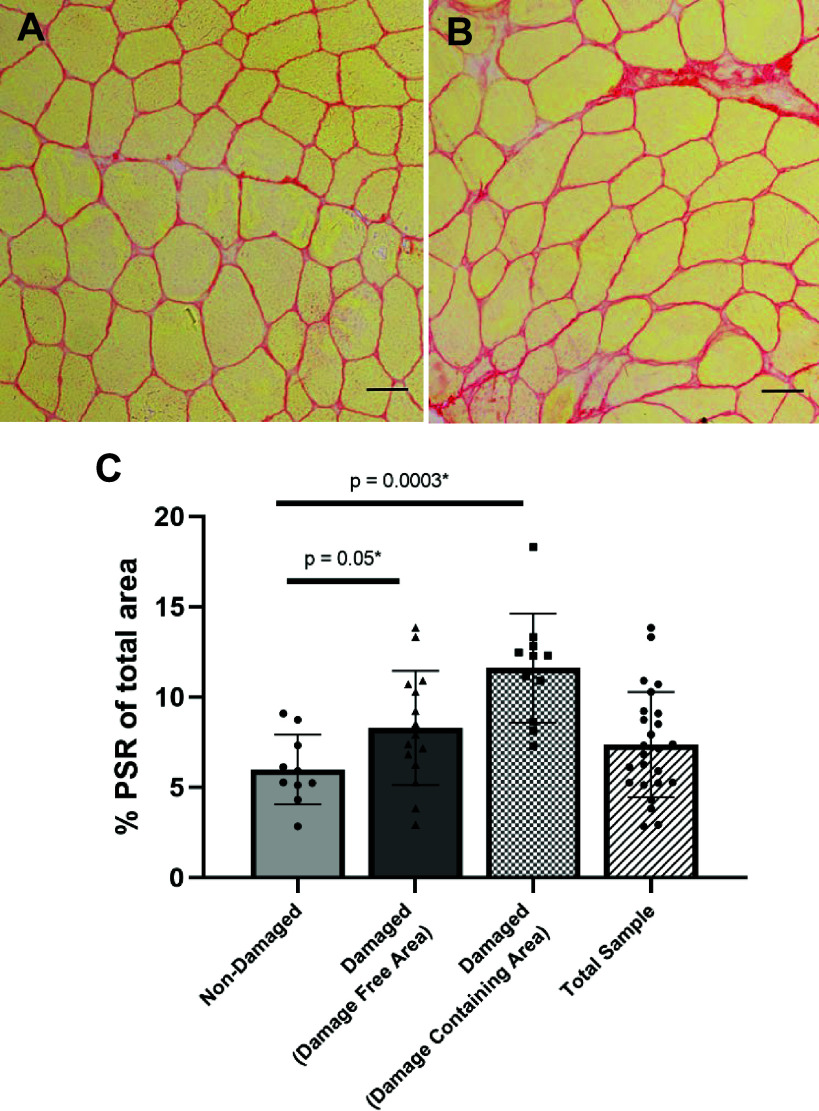
Figure 5.
Collagen content is higher in muscle biopsies in the damaged group. Representative images of damage-free muscle areas of biopsies from the nondamaged (A) and damaged (B) groups. Percent picrosirius red (PSR) of biopsies (C) for nondamaged biopsies and damage-free area in damaged biopsies (labeled “damaged”) as well as areas specifically containing obvious damage (“damage-specific area”). n = 10 for nondamaged and n = 16 for damaged group. Scale bars 100 µm. Values are means ± SD.

