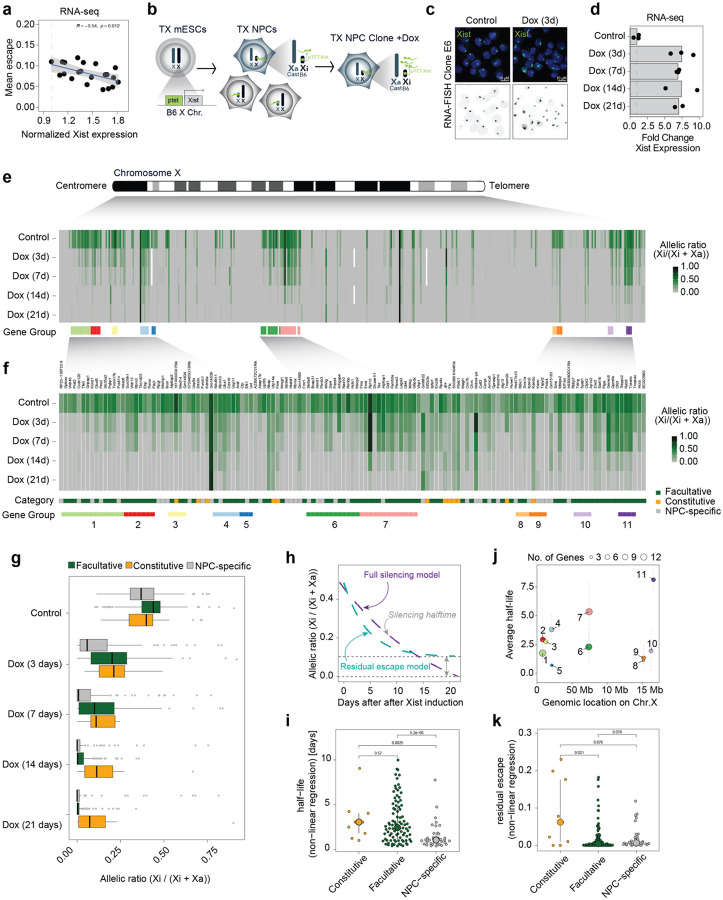
Figure 1: Increased levels of Xist RNA silences Xi escapees in NPCs.
a, Scatterplot showing a correlation between average escape and Xist expression using RNA-seq data from 21 NPC clones (129/Sv x Cast/Eij genetic background). Mean escape is calculated as the average allelic ratio (Xi/(Xi+Xa)) across 439 informative genes. Normalised Xist expression is calculated as library-size scaled counts per million (CPM), divided by the value for the lowest clone. R specifies Pearson’s correlation coefficient, the p-value is given by a correlation test. b, Experimental outline: TX ESCs carrying a ptet tetracycline-responsive promoter upstream of the Xist gene on the B6 X chromosome were differentiated NPCs without doxycycline. Single clones carrying the inactivated B6 allele were picked and expanded and Xist RNA levels were increased by adding doxycycline to the culture media. c, FISH for Xist RNA (green) in NPC clone E6 in untreated conditions (Control) and after 3 days of doxycycline treatment (Dox 3d). DNA is stained with DAPI. d, RNA-seq data showing the fold change in Xist expression (normalised CPM) compared to untreated cells across the time course of doxycycline treatment. Data relative to the mean of measurements in clone E6 is shown. e, Schematic of the mouse X chromosome and heatmap showing X-linked transcript allelic ratios in untreated clone E6 and after 3, 7, 14 and 21 days of doxycycline treatment. Allelic ratio indicates the fraction of reads from the Xi (ratio=1: Xi monoallelic expression; ratio=0: Xa monoallelic expression; ratio=0.5: biallelic expression; ratio > 0.1: escape). Gene groups are defined as contiguous groups of escapees within 100 kb of each other (see Methods). f, Heatmap showing the allelic ratio of 134 escapees identified in clone E6 and shown in e. Escapees are assigned to three different categories as indicated in Extended data Fig.1g and described in Methods). The escape category for each gene is indicated below the heatmap together with the zoom in of the gene groups shown in e. g, Box plot showing the changes in allelic ratios for different escape categories across the time course of doxycycline treatment. Data of clone E6 is shown. h, Schematic of the exponential decay models used to study gene silencing kinetics. Data can be described by a full silencing model (blue, allelic ratio approaches 0) or a residual escape model (green allelic ratio approaches value > 0.1. The steepness of the curve corresponds to the genes silencing half-life). i, Beeswarm plot showing the distributions of silencing half-life fit to all escapees using the offset model and stratified by escapee classification. P-values are computed using Wilcoxon’s Rank Sum test (not adjusted for multiple testing). j, Silencing Half-lives per gene group as shown in (f). Large dots show mean and whiskers standard deviations across genes in the group. k, Beeswarm plot showing the distributions of residual escape parameters fit to all escapees using the offset model and stratified by escapee classification. P-values are computed using Wilcoxon’s Rank Sum test (not adjusted for multiple testing).

