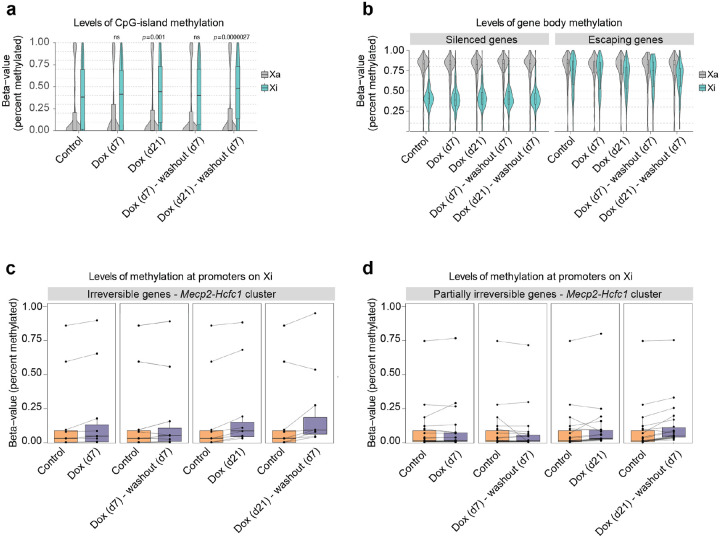
Figure 5: Irreversible silencing of escapees is maintained by DNA methylation.
a, Box- and Violin plots showing allele-specific DNA methylation levels of CpG islands for control, doxycycline-treated and washout samples. For each GpG island, the average fraction of methylated cytosines is calculated across CpG sites from haplotype-informative reads. Shown are active (Xa=Cast) and inactive (Xi=B6) chromosomes separately. P-values are calculated using a paired Wilcoxon’s rank sum test. b, As (a), but showing methylation levels across gene bodies for silenced and escaping genes, as derived from the gene expression data in Fig. 1. c, Quantification of DNA methylation on promoters of irreversible escapees in the Mecp2/Hcfc1-cluster. Promoters are defined as regions of accessible chromatin as measured by ATAC-Seq that overlap (−500bp, 1000bp)-intervals around annotated TSSs. DNA methylation is defined as the average fraction of methylated Cs across the ATAC-peak region. Data is shown paired to untreated cells. d, As (c) for genes that are partially irreversible.

