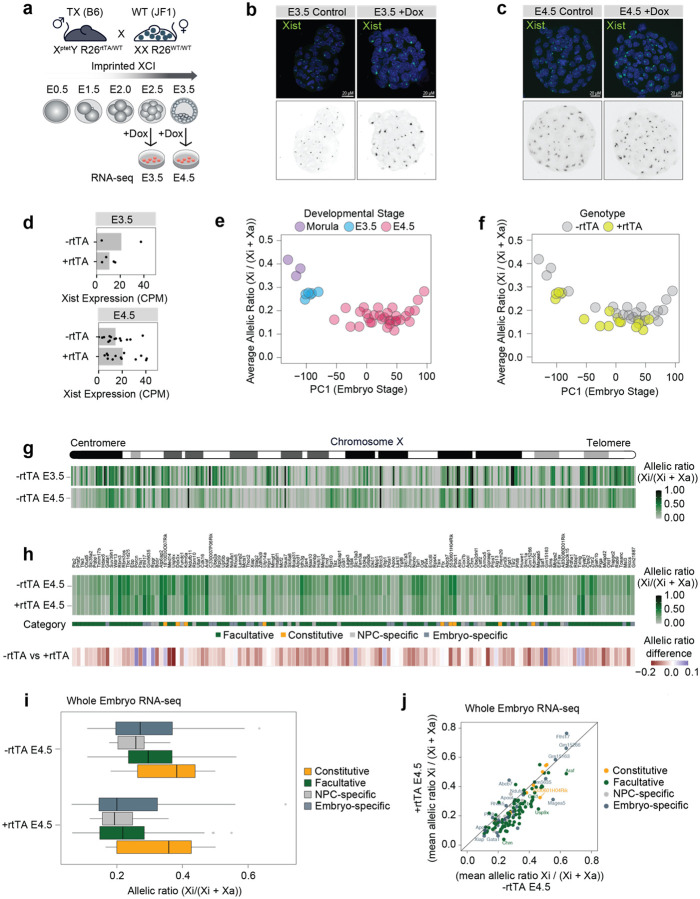
Figure 6: Xist levels modulate X-linked dosage in vivo.
a, Experimental outline: males TX B6 mice (XptetY; R26rtTA/WT) were crossed with WT JF1 females. F1 embryos were collected at E2.5 and E3.5 and cultured for 24 hours while adding doxycycline to the culture media. RNA-seq was performed at E3.5 and E4.5. b-c, FISH for Xist RNA (green) in (b) E3.5 and (c) E4.5 XX embryos obtained by crossing males TX B6 mice (XptetY; R26rtTA/rtTA) with WT JF1 females. DNA is stained with DAPI. d, Whole embryo RNA-seq at E3.5 and E4.5 showing Xist RNA levels (normalized CPM) in females carrying the rtTA transactivator compared to WT females (Methods). Each dot represents one embryo. e, Scatterplot showing average escape across the embryo stage as defined by principal component analysis on the whole transcriptome (Methods). Average escape is defined as the mean allelic ratio of all expressed X-linked genes. Developmental stage annotations are defined based on embryo morphology. f, As (e), but showing rtTA genotypes based on RNA-seq. Embryos are classified as +rtTA by PCR and if at least 50 reads mapped to the rtTA transgene (Methods). g, Schematic of the mouse X chromosome and heatmap showing the allelic ratios of X-linked genes expressed in female embryos at E3.5 and E4.5. For each gene and developmental stage, the median allelic ratio is shown. h, Heatmap showing the mean allelic ratios of 135 escapees in E4.5 embryos carrying rtTA (+rtTA) and in matching controls (+rtTA). Escapees are categorised as in Extended data Fig.1g, with genes additionally called “embryo-specific” if they show an allelic ratio > 0.1 in >50% of -rtTA embryos and do not escape in NPCs. Below, the mean difference in allelic ratios between -rtTA and +rtTA embryos are shown. i, Box plots showing mean allelic ratios for -rtTA and +rtTA embryos for the different escapee categories. j, Scatterplot showing the same data as in (i), but directly comparing allelic ratios in -rtTA and +rtTA embryos.

