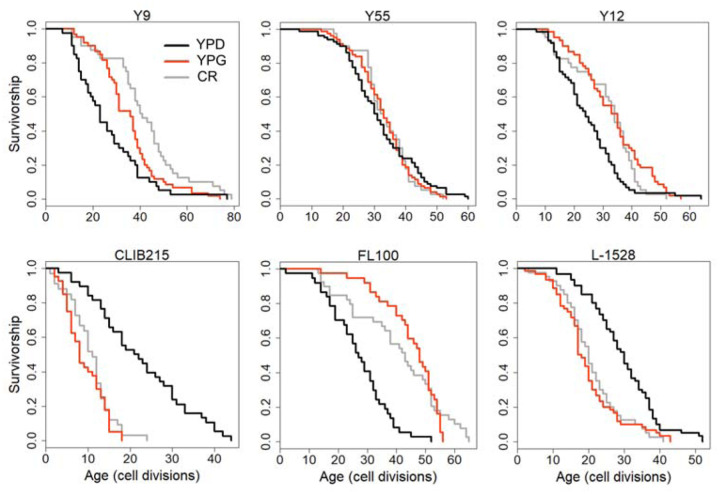
Figure 12: Examples of lifespan curves for the selected strains of S. cerevisiae analyzed under different metabolic conditions.
RLS assays were conducted under control YPD (2% glucose, black lines), YPD-CR (0.05% glucose, gray lines), and YPG (3% glycerol, red lines) medium conditions. The raw data and statistical significance can be found in Supplementary File 1.

