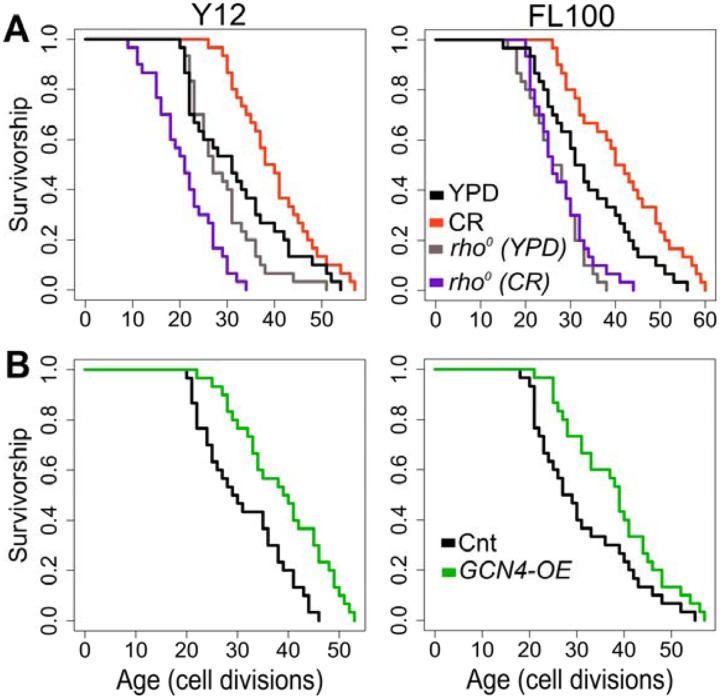
Figure 13: RLS effect of mitochondrial DNA (mtDNA) elimination and GCN4 overexpression in selected responding strains.
RLS phenotypes of Y12 (left panels) and FL100 (right panels) strains (A) rho0 isolates under high glucose condition (gray lines) and CR condition (purple lines) along with the RLS phenotypes of control parental strains under high glucose (YPD: black lines) and CR conditions (red lines) are also shown (B) Lifespan curves for control (black) and GCN4 (green) overexpression. Lifespan data and the significance of lifespan changes can be found in Supplementary File 1.

