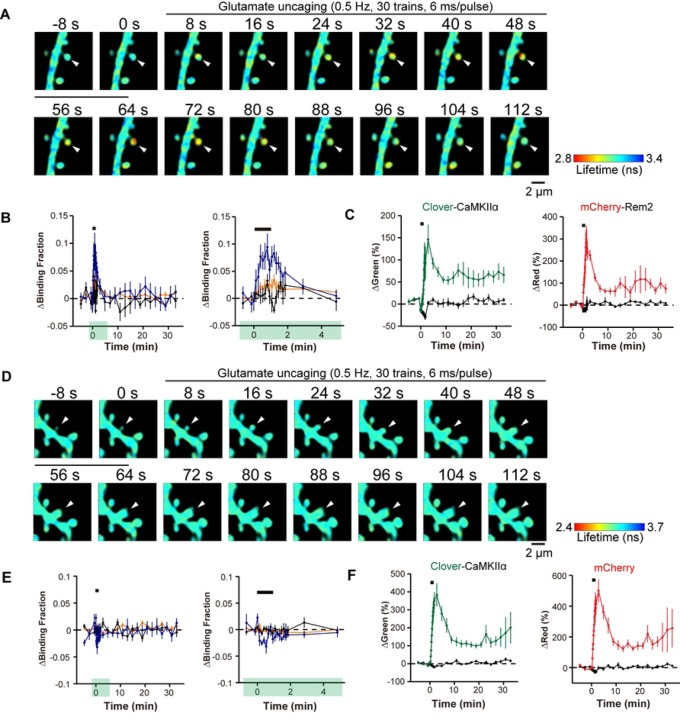
Figure 5.
Rem2 interacts with CaMKII in a 2-photon FLIM-FRET assay. Representative fluorescence lifetime images of Clover-CaMKIIα and mCherry-Rem2 interaction (A) or Clover-CaMKIIα and mCherry interaction (D) during spine structural plasticity induced by two-photon glutamate uncaging. The arrowhead indicates the stimulated spine. Warmer colors indicate shorter fluorescent lifetimes, therefore increased interaction between proteins. B) Time course of CaMKII and Rem2 interaction measured as a change in the fraction of Clover-CaMKIIα bound to mCherry-Rem2 in stimulated spines (blue, n = 7), the dendritic shaft beside the stimulated spines (orange, n = 7), and adjacent spines (black, n = 7). The right panel shows a 5-minute window of the imaging data from the left panel as indicated by green highlighting. Error bars = SEM. n = 5 neurons. The black bar indicates glutamate uncaging. C) Averaged time course of spine volume change in the same experiments as in B for Clover-CaMKIIα and mCherry-Rem2 in stimulated spines (green for Clover-CaMKIIα, red for mCherry-Rem2, n = 7) and in adjacent spines (black, n = 7). E) Time course of CaMKII and mCherry interaction measured as a change in the fraction of Clover-CaMKIIα bound to mCherry in stimulated spines (blue, n =7), the dendritic shaft beside the stimulated spines (orange, n = 7), and adjacent spines (black, n = 14). The right panel shows a 5-minute window of the imaging data from the left panel as indicated by green highlighting. Error bars = SEM. n = 6 neurons. F) Averaged time course of spine volume change in the same experiments as in E for Clover-CaMKIIα and mCherry, in stimulated spines (green for Clover-CaMKIIα, red for mCherry, n = 7) and in adjacent spines (black, n = 7). The black bar indicates glutamate uncaging.

