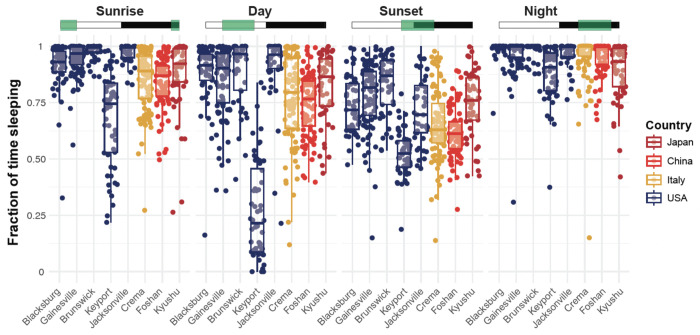
Figure 6. Sleep amounts varied between strains and phases of the day.
Average fraction of time spent in a sleep-like state during the day by individual mosquitoes during the sunrise (ZT 22-4), day (ZT 4-10), sunset (ZT 10-16), or night (ZT 16-22) phase. The Green boxes indicate the time windows selected for each comparison subplot, where white rectangles indicate the Zeitgeber times when the light is ON, and the black rectangles indicate times when the light is OFF. Each point represents an individual mosquito; box plots represent the median, quartiles, and 95% confidence intervals. For clarity, significant differences are reported in Supplementary Table 2. Strains are color-coded as a function of the country of origin of the population.

