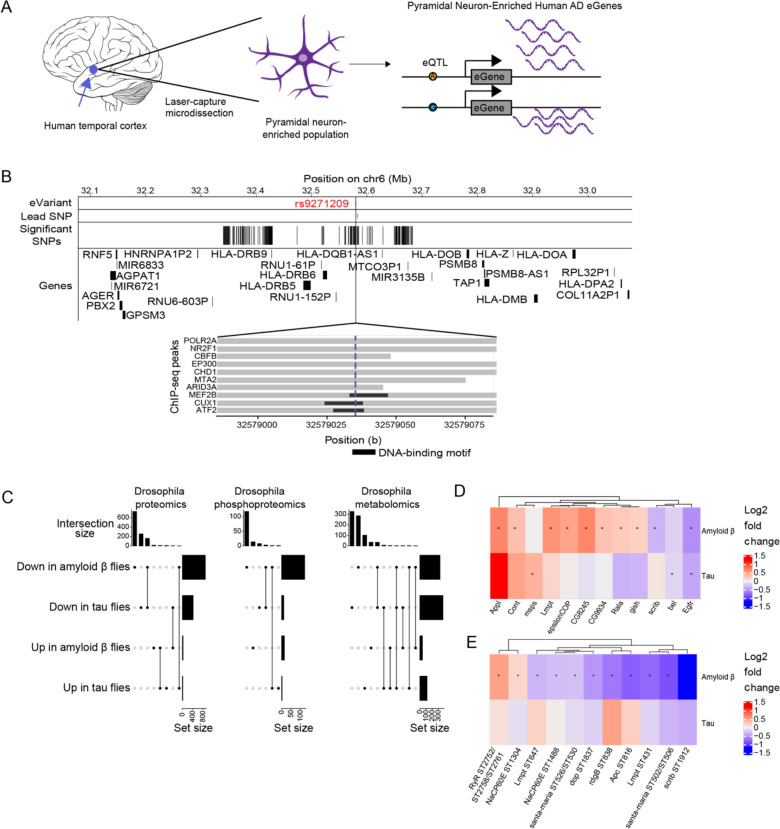
Figure 3.
Multi-omic changes in human AD patients and model systems. A) Schematic depicting laser-capture microdissection of temporal cortex pyramidal neuron-enriched populations and identification of eGenes. Brain cartoon created with Biorender.com. B) The eQTL associated with the eGene HLA-DRB1 is highlighted in red and overlaps with DNA binding motifs of MEF2B, CUX1 and ATF2 derived from ENCODE ChIP-seq and FIMO-detected motifs. Grey horizontal bars indicate ChIP-seq binding regions and the black horizontal bars indicate where the DNA-binding motif is located. C) UpSet plots indicate the number of proteomic, phosphoproteomic, and metabolomic changes change in the same or different directions when comparing Aβ1–42 transgenic flies (Amyloid β flies) to controls with those associated with comparing tauR406W transgenic flies (tau flies) to controls. The top bar plot indicates how many changes fit into the set depicted by the dots below, while the rightmost bar plot indicates the total number of proteins, phosphoproteins or metabolites that are upregulated in tauR406W transgenic flies, downregulated in tauR406W transgenic flies, upregulated in Aβ1–42 transgenic flies, or downregulated in Aβ1–42 transgenic flies. D) Heat maps depict the log2 fold changes between Aβ1–42 transgenic flies or tauR406W transgenic flies with controls for D) proteins or E) phosphoproteins that were hits in the age-associated neurodegeneration screen. An asterisk indicates whether the comparison was significant at an FDR threshold of 0.1. The columns of all heatmaps were clustered by hierarchical clustering.

