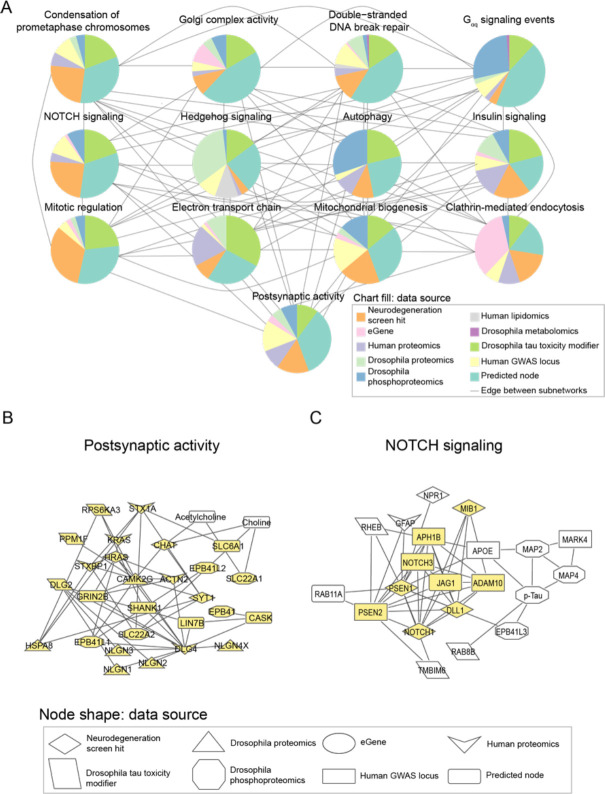
Figure 4.
Network integration of Alzheimer’s disease multi-omics and novel genetic screening data identifies subnetworks characterized by hallmarks of neurodegeneration and processes previously not implicated in Alzheimer’s disease. A) Network integration of human and Drosophila multi-omics for Alzheimer’s Disease highlights subnetworks enriched for proteins belonging to known gene ontologies. Each subnetwork is represented by a pie chart, which indicates the proportion of nodes represented by a given data type. Edges indicate if at least one node in one subnetwork interacts with a node in the other subnetwork. Each pie chart is labeled by the enriched biological process by hypergeometric test (FDR-adjusted p-value less than 0.1). B) A subnetwork enriched for postsynaptic activity. Nodes belonging to the annotated process are highlighted in yellow. Also in this subnetwork are metabolites associated with postsynaptic activity such as acetylcholine. C) Phosphorylated tau, APOE, and APP-processing proteins interact with each other and are in a subnetwork enriched for NOTCH signaling-associated genes. Members of the NOTCH signaling pathway are highlighted in yellow.

