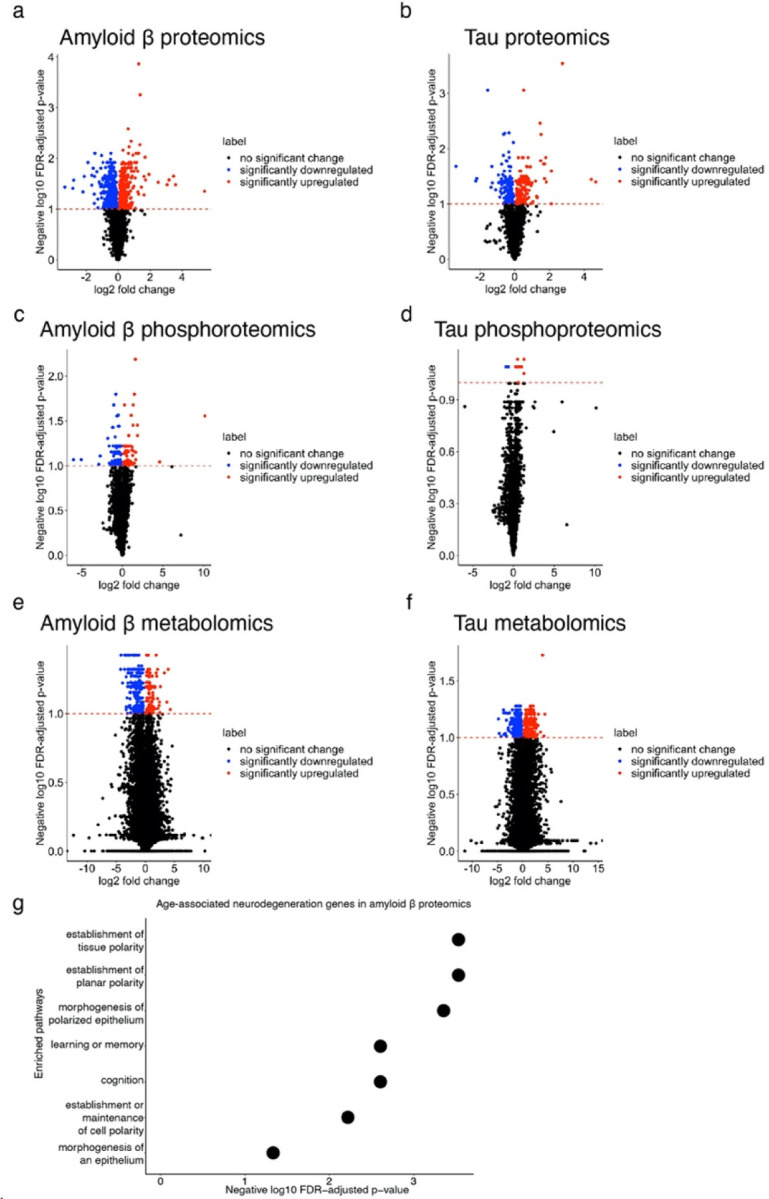
Extended Data Fig. 4.

related to Fig. 3. Volcano plots depicting negative log10 FDR-adjusted p-values and log2 fold changes between case and control in a) proteomics from Aβ1–42 transgenic flies (amyloid β), b) proteomics from tauR406W transgenic flies, c) phosphoproteomics from Aβ1–42 transgenic flies, d) phosphoproteomics from tauR406W transgenic flies, e) metabolomics from Aβ1–42 transgenic flies, and f) metabolomics from tauR406W transgenic flies Blue dots indicate significantly downregulated omics and red dots indicate significantly upregulated omics. The horizontal red dashed line indicates the FDR cut-off at 0.1. g) Dot plot indicating GO terms overrepresented in neurodegeneration screen hits that are differentially abundant in proteomics from Aβ1–42 transgenic flies.
