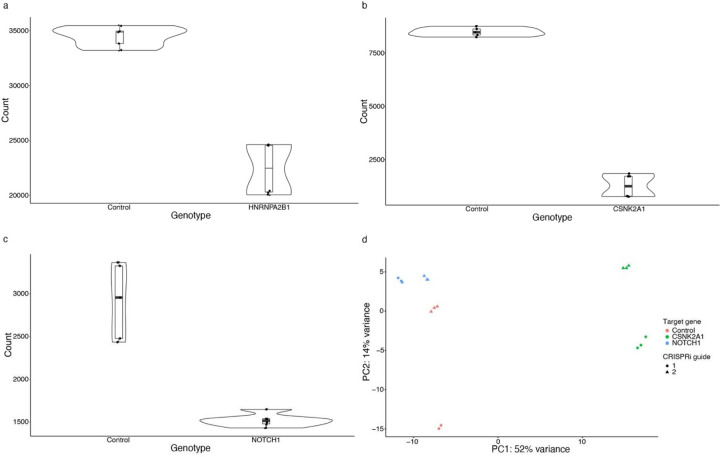
Extended Data Fig. 6.
related to Figs. 5 and 6: Knockdown efficiency and principal component analysis of the NGN2 RNA-seq data. Violin plots depict library-corrected RNA-seq counts in NGN2 neuronal progenitor cells for controls and a) HNRNPA2B1, b) CSNK2A1 or c) NOTCH1 knockdown. d) Principal Component Analysis plot of individual control, NOTCH1 and CSNK2A1 RNA-seq replicates from expression data. Colors indicate the knockdown for each replicate and the shape indicates whether the knockdown was performed with the first or second guide RNA. For control, we used non-targeting guide RNAs.

