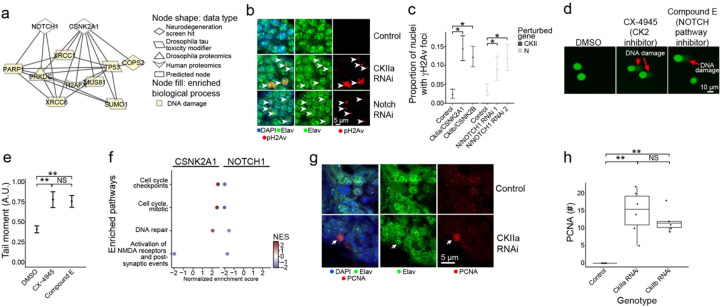
Fig. 6:
Network analysis implicates neurodegeneration genes as regulators of the AD-associated biological process of DNA damage repair. a) NOTCH1 and CSNK2A1 interact with a diversity of AD-specific omics that are involved in DNA damage repair processes. Nodes involved in DNA damage are highlighted in yellow. b) Knockdown of Drosophila orthologs for NOTCH1 and CSNK2A1 lead to increased DNA damage in neurons of the adult fly brain as measured by increased numbers of foci positive for the DNA double-strand break marker pH2Av (red, arrowheads). pH2Av is the Drosophila ortholog of mammalian pH2AX. Neurons are identified by elav immunostaining (green). Nuclei are identified with DAPI immunostaining (blue). The scale bar represents 5 μm. c) Percent of nuclei containing pH2Av foci in control flies, Drosophila knockdowns of orthologs of CSNK2A1 (CKIIa and CKIIb) and NOTCH1 (N). Asterisks indicate significance of a one-way binomial test after Benjamini-Hochberg FDR correction p<0.01. Error bars are 95% binomial confidence intervals. n=6. Controls are elav-GAL4/+; UAS-Dcr-2/+ (CKII knockdown) or elav-GAL4/+ (N knockdown). Flies are 10 days old. d) Inhibition of Casein Kinase 2 (CK2) by CX-4945, and the inhibition of NOTCH cleavage by Compound E enhances DNA damage in human iPSC-derived neural progenitor cells measured by the COMET assay. e) Quantification of the tail moments from panel A in arbitrary units. Asterisks indicate p<0.01 by ANOVA with Tukey’s Post-Hoc correction. Error bars indicate standard error of the mean. f) Dot plots showing the normalized enrichment scores (NES) of selected, significantly enriched REACTOME pathways after CSNK2A1 and NOTCH1 knockdown in NGN2 neural progenitor cells. Red and blue dots indicate positive and negative NES, respectively, reflecting upregulation or downregulation of pathways. Pathways were selected to show shared changes in pathways related to cell cycle, DNA repair and postsynaptic activity. g) Representative immunofluorescence images of mature neurons in Drosophila brains show inappropriate cell cycle re-entry in postmitotic neurons as indicated by PCNA expression (red, arrow) following CKIIa knockdown. The neuronal marker elav identifies neurons (shown in green). PCNA, elav (neurons) and DAPI are represented in red, green, and blue respectively. h) Quantification of PCNA expression in control brains and brains of Drosophila with knockdown of orthologs of CSNK2A1 (CKIIa and CKIIb). Asterisks indicate p<0.01 by ANOVA with Tukey’s Post-Hoc correction. n=6. Control is elav-GAL4/+; UAS-Dcr-2/+. Flies are 10 days old.

