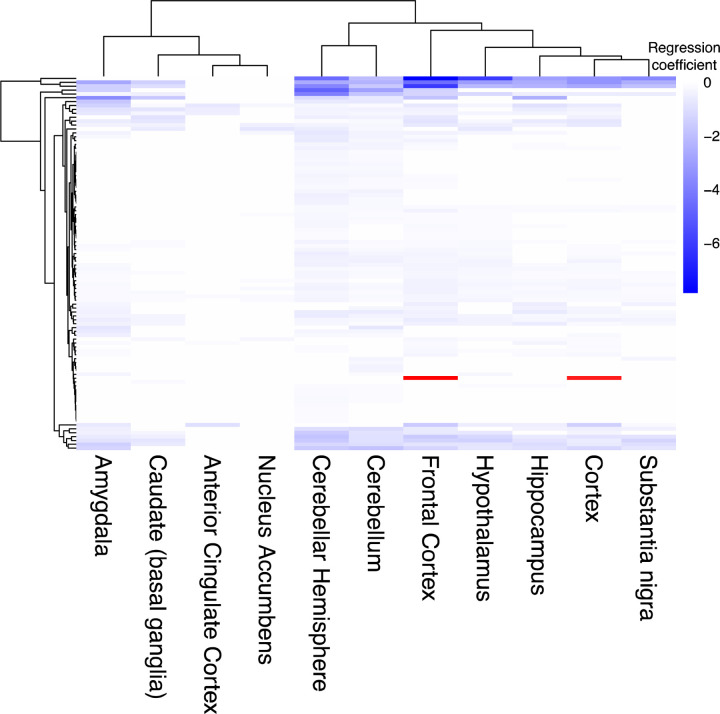
Extended Data Fig. 1.
related to Fig. 2: Neurodegeneration screen hits have significant changes in gene expression with respect to age across multiple brain tissues. Heatmap depicts significant linear mixed model regression coefficients between the expression of neurodegeneration screen hits and patient age in human RNA-seq in the Genotype-Tissue Expression project (GTEx) for each brain tissue. Each row is an age-associated neurodegeneration gene while each column indicates the brain tissue in GTEx, grouped by hierarchical clustering. Blue indicates a negative association and red indicates a positive association between gene expression in age as measured by the model regression coefficient. The gene with a positive regression coefficient is HES6.

