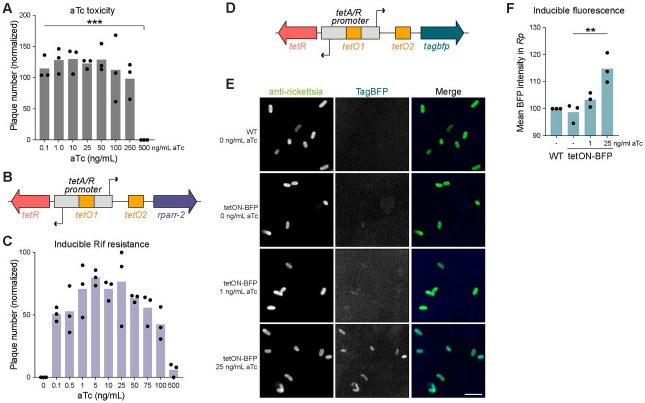
Figure 1. The Tet-On system enables conditional gene expression in R. parkeri.
(A) Anhydrotetracycline (aTc) toxicity curve in R. parkeri. Plaque assays were performed on Vero cell monolayers with varying concentrations of aTc indicated. The number of plaques formed at each aTc concentration was normalized to the no aTc control for each independent experiment (n = 3). *** represents p < 0.001 by ordinary one-way ANOVA with post hoc Tukey’s test.
(B) Schematic of the Tet-On system cloned into pRAM18dSGA. The tet repressor, TetR, binds two tet operator sites (tetO) to block gene expression in the absence of aTc. The rparr-2 gene, which confers resistance to rifampicin, was placed under the control of Tet-On. Diagram not drawn to scale.
(C) aTc induction of rifampicin resistance. Varying concentrations of aTc were added 30 mpi during plaque assays in Vero host cell monolayers. Each well shown had rifampicin added (200 ng/mL final concentration). All conditions shown were normalized to a no aTc and no rifampicin control well per independent experiment (n = 3).
(D) Schematic of tagbfp cloned into the Tet-On system. The tagbfp gene was codon optimized for expression in R. conorii14. Diagram not drawn to scale.
(E & F) aTc induction of TagBFP during infection. A549 cell monolayers were infected with R. parkeri harboring a plasmid containing tagbfp under the control of Tet-On. aTc was added 24 hpi, then samples were fixed at 48 hpi and subsequently imaged. (D) All images were set to the same minimum and maximum grey values per channel for comparison of BFP intensity. Scale bar, 2 μm. (E) Blue fluorescence from the expression of tagbfp was quantified for each bacterium across three independent experiments. ** denotes p < 0.01 using an ordinary one-way ANOVA.

