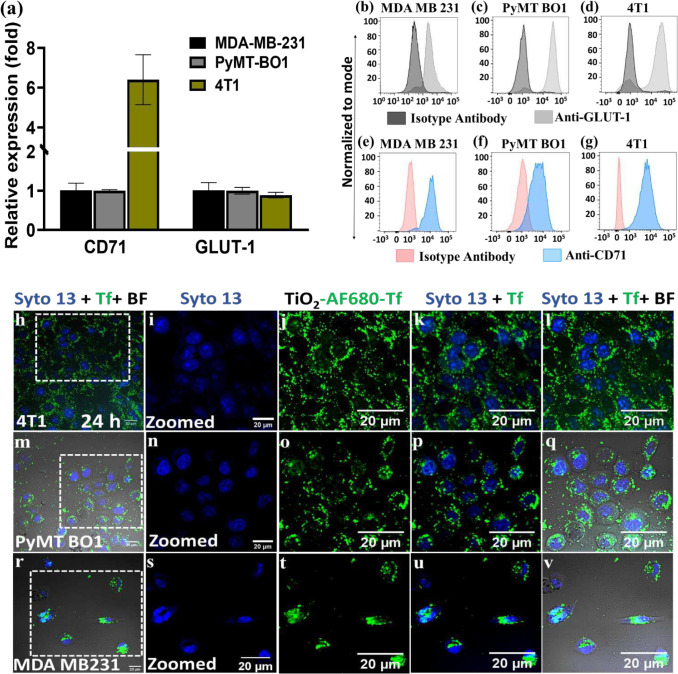
Fig. 1|. Cellular expression of target receptors and internalization of RaST components.
(a) Quantitative analysis of CD71 and GLUT-1 mRNA expression using RT qPCR technique (n=6). (b-d) Quantitative analysis of CD71 and (e-g) GLUT-1 protein expression using flow cytometry analysis (n=3 independent sets). (h-v) Representative images of the internalization and distribution of Alexa Fluor 680-Tf-TO2 (25 μg/ 100 μl) in different breast cancer cell lines (n=3 independent sets). Dotted square insets are shown magnified in the images on the right. Scale bars = 20 μm, 1024 by 1024 aspect ratio, magnification 600 x with a confocal microscope.

