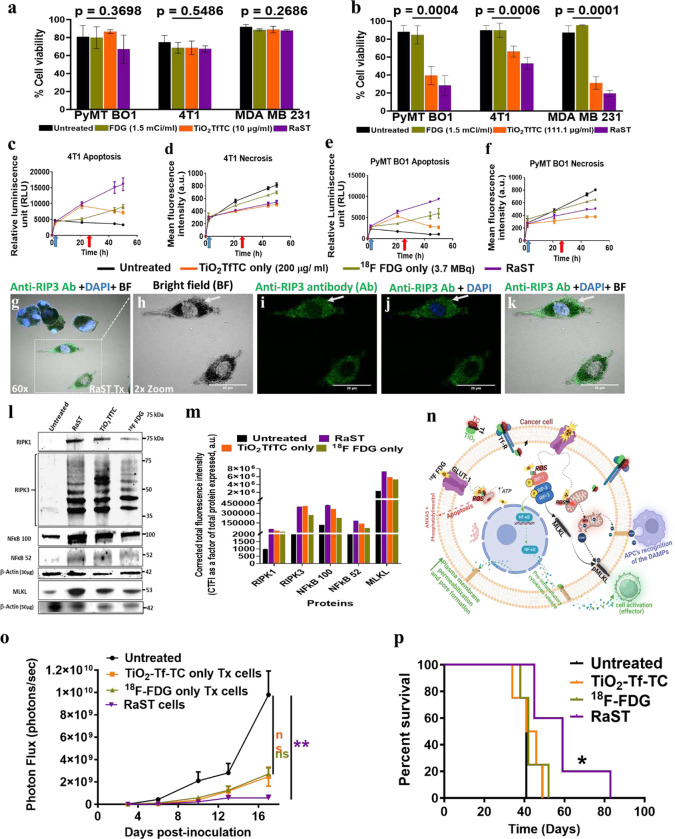
Fig. 2|. RaST-induced cell death mechanisms and host response to necroptosis challenge.
(a-b) Dye exclusion cell viability test with Trypan blue dye post-RaST (18FDG + TiO2-TC-Tf) versus 18FDG alone or TiO2-Tc-Tf alone treatments in the three breast cancer cell lines using a (a) low (10.0 μg/ml) and (b) high (111.1 μg/ml) dose of TiO2-TC-Tf. There was mild to no cytotoxic effect for PyMT-BO1 (p = 0.3698), 4T1 (p =0.5486), and MDA-MB231 (p= 0.2686) in the low dose group. Groups treated with the higher concentration exhibited a significant cytotoxic effect in the RaST group compared to TiO2-TC-Tf, 18FDG, and the untreated groups. One-way ANOVA (non-parametric test) and Kruskal-Wallis multiple comparison tests for the PyMT-BO1 (p-value = 0.0004), 4T1 (p =0.0006), and MDA-MB231 (p= 0.0001) in the high dose showed significant cell type-dependent response. (c-f) Time-dependent cell death measurement using a parallel real-time apoptosis and necrosis assay on 4T1 and PyMT-BO1 breast cancer cells. Blue arrow is the initial background cell death reading at 2 h post-apoptosis and necrosis reagents addition, while the red arrow marks the 18FDG addition for RaST induction. (g-k) Confocal microscopy of RaST-treated PyMT-BO1 cells stained with anti-RIP3 Ab (green) and DAPI (blue) showing a strong positive RIP3 stain and morphological changes such as irregular membrane and pale nuclear stain at 48 h post-RaST. Scale bar 20 μm. (l) Western blot of necroptosis downstream signaling protein expression in the untreated, 18FDG, TiO2-TC-Tf, and RaST; RIP1, RIP3, NFkB 100 and 52 (30 μg/well), and MLKL (50 μg/well). (m) Quantitative analysis of the protein bands for each necroptosis-associated downstream protein using the manufacturer’s calculated molecular weights. (n) Schematic representation of the proposed cellular level necroptosis induction through a death receptor-independent pathway activated by RaST. (o) RaST-induced necroptosis challenge with pretreated PyMT-BO1 GFP Luc cells inoculated in mammary fat pads and tumor growth followed using BLI. (p) Kaplan Meier survival analysis. P-value = * ≤ 0.05, **≤ 0.01, and ***≤ 0.001. Blue and red arrows or triangles represent TiO2TC-Tf and 18FDG treatment, respectively.

