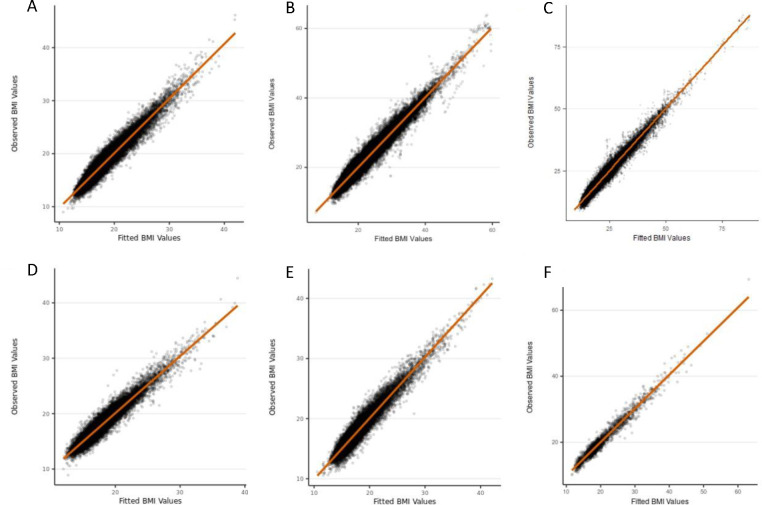
Figure 2: Observed BMI measures versus fitted BMI values from our final chosen model (cubic spline function in the fixed effects with cubic slope function in the random effects) in males.
A) ALSPAC; B) CHOP European subset; C) CHOP African American subset; D) NFBC1966; E) NFBC1986; F) OBE. BMI is given in kg/m2

