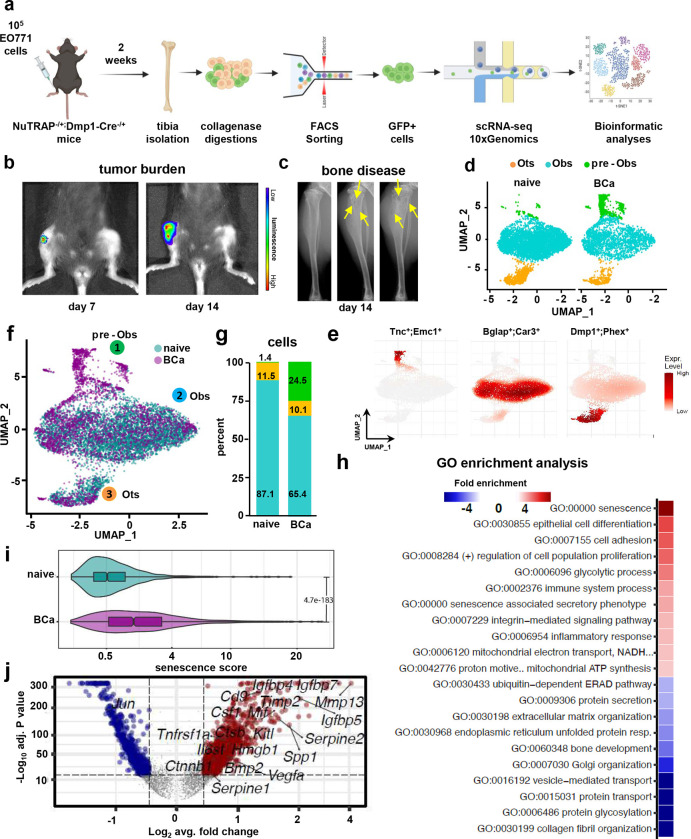
Figure 1. Single-cell transcriptomic profiling of osteoblastic cells in breast cancer bone metastasis.
(a) Schematic of experimental design. (b) Tumor bioluminescence and (c) osteolytic lesions in X-Ray (yellow arrows) seven and fourteen days after tumor inoculation. Representative images per group are shown. Uniform Manifold Approximation and Projection (UMAP) plot representations of osteoblastic cells isolated from control (naïve) or mice with breast cancer bone metastasis (BCa) showing (d) three clusters: osteocytes (Ots), osteoblasts (Obs), and pre-osteoblasts (pre-Obs) and (f) cluster cell distribution by group. Each dot represents a single cell, and cells sharing the same color code indicate discrete populations of transcriptionally similar cells (d) or from the same group (f). (e) Expression density plots with gene markers defining cluster identities. (g) The proportion of cells from each cluster in the naïve vs. BCa group. (h) Gene ontology (GO) enrichment analysis in genes differentially expressed between naïve vs. BCa osteoblastic cells. Positive values represent GO term enrichment in the BCa vs. naïve group. (i) Comparison of the senescence score in osteoblastic cells from naïve vs. BCa mice. (j) Volcano plot ranking genes according to their relative abundance (log2 fold change) and statistical value (−log10 p-value). Dots show significant upregulated (red) and down-regulated (blue) genes from naïve vs. BCa mice in osteoblastic cells.

