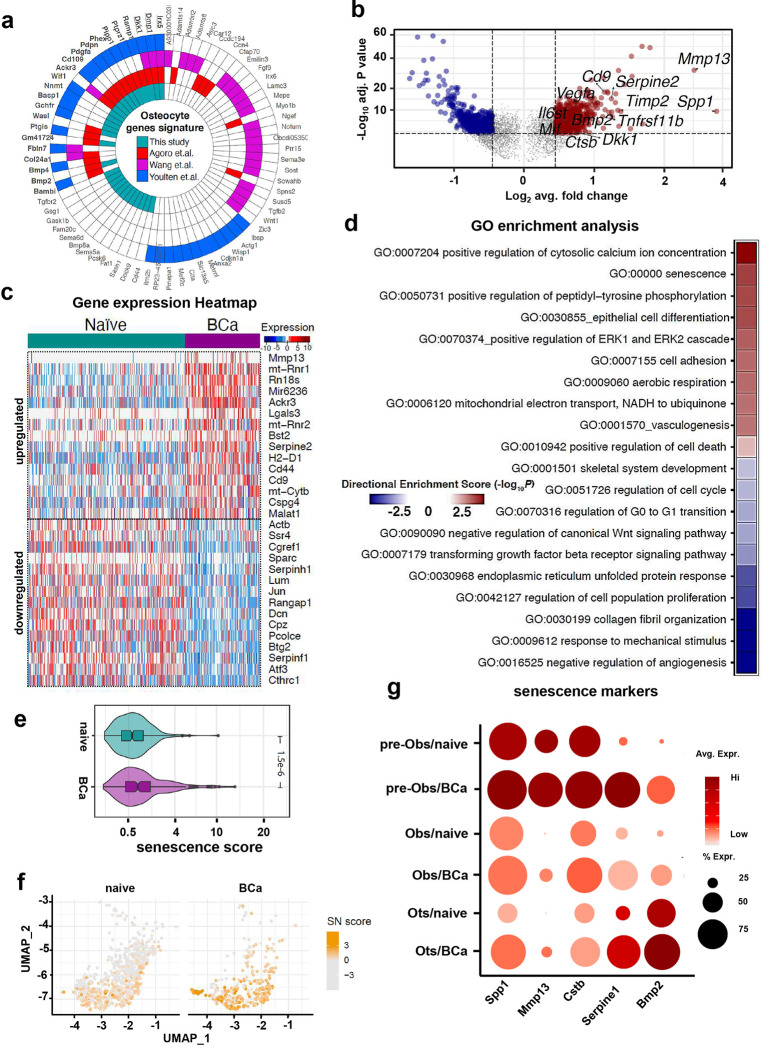
Figure 2. Osteocytes from bones with breast cancer tumors exhibit upregulation of genes associated with cellular senescence.
(a) Polar plot showing osteocyte gene markers identified in our dataset compared to those previously reported by Agoro et al., Wang et al., and Youlten et al. Functional enrichment analysis results of Ots genes signature from different published resources. (b) Volcano plot ranking genes according to their relative abundance (log2 fold change) and statistical value (−log10 p-value). Dots show significant upregulated (red) and down-regulated (blue) genes in osteocytes from naïve vs. BCa mice. (c) Gene expression heatmap of the top 15 differentially expressed genes in osteocytes from naïve vs. BCa mice. (d) Gene ontology (GO) enrichment analysis in genes differentially expressed in osteocytes from control (naïve) vs. bones breast cancer tumors (BCa). Positive values represent GO term enrichment in osteocytes from the BCa vs. naïve group. (e) Comparison of the senescence score in osteocytes from naïve vs. BCa mice. (f) Uniform Manifold Approximation and Projection (UMAP) plot representations of osteocytes isolated from naïve or BCa mice showing the senescence score distribution by group. Each dot represents a single osteocyte, and the color intensity is proportional to the senescence score. (g) Bubble plot comparing expression of selected senescent markers in osteocytes (Ots), osteoblasts (Obs), and pre-osteoblasts (pre-Obs) from naïve vs. BCa mice. Bubble size is proportional to the percentage of cells in each cluster expressing a gene, and color intensity is proportional to average scaled gene expression within a cluster.

