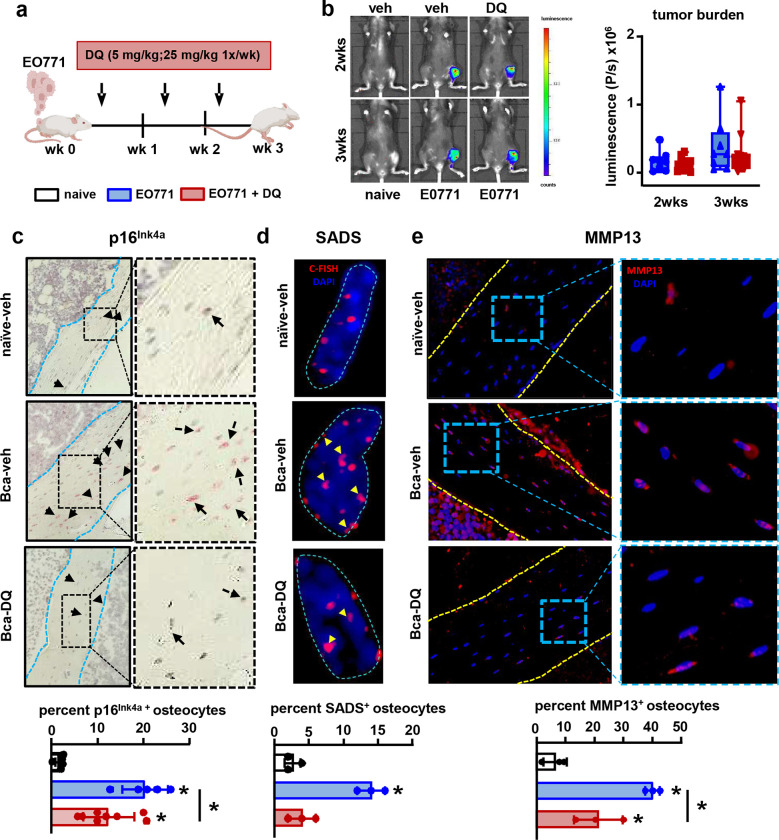
Figure 6. Senolytic therapy blunts the increase in senescent osteocytes in mice with breast cancer bone metastasis.
(a) Experimental design. (b) Representative in vivo bioluminescence images and luminescence quantification in control mice (naïve) vs. mice with EO771 breast cancer bone metastasis (BCa) treated with vehicle (veh) or the senolytics Dasatinib and Quercetin (DQ). n=10 mice/group. (c) Representative images and prevalence of p16Ink4a+ primary osteocytes in bones from naïve and breast cancer mice receiving veh or DQ three weeks after tumor inoculation. Black arrows indicate p16Ink4a+ osteocytes. Blue dashed lines indicate the bone surface. n=5–8 mice/group. (d) Representative images and prevalence of senescence-associated distension of satellites (SADS)+ primary osteocytes in bones from naïve and BCa mice receiving veh or DQ three weeks after tumor inoculation. Yellow arrows indicate SADS events. Blue dashed lines indicate the nuclei’s contour. C-FISH: centromere-FISH. n=3 mice/group. (e) Representative images and prevalence of MMP13+ primary osteocytes in bones from naïve and BCa mice receiving veh or DQ three weeks after tumor inoculation. Yellow dashed lines indicate the bone surface. n=3/group. *p<0.05 vs. vehicle by One Way ANOVA. Data are shown as mean ± SD; each dot represents an independent sample.

