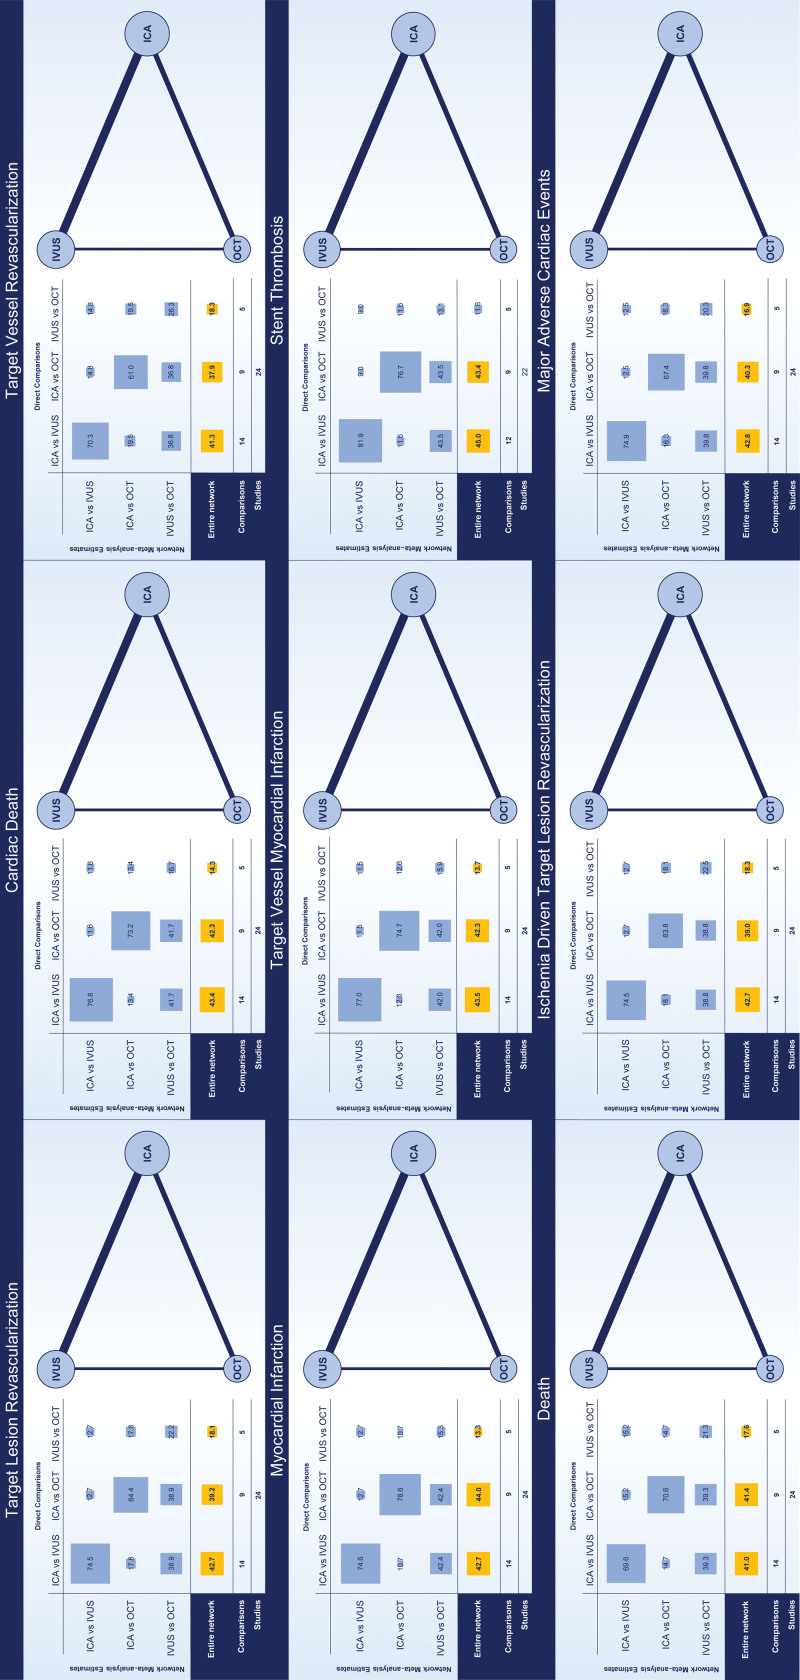
Figure 1.
Networks of the evidence. The network of the evidence for each outcome is illustrated. The size of nodes (ie, guidance strategies) is proportional to the number of patients pooled. The thickness of the connection between nodes is proportional to the number of comparisons. The distribution of the evidence across the comparison and the entire network is illustrated in the Table. ICA indicates invasive coronary angiography; IVUS, intravascular ultrasound; and OCT, optical coherence tomography.

