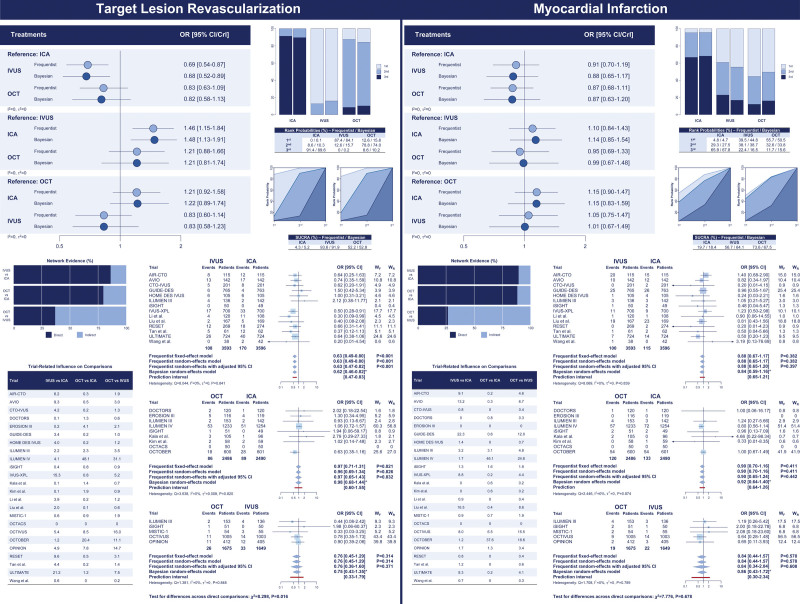
Figure 2.
Target lesion revascularization and myocardial infarction: network comparisons. Left, Target lesion revascularization. Right, Myocardial infarction. The results of the frequentist (light blue) and network meta-analyses (dark blue) are illustrated in the forest plot located in the top portion of each of the 2 panels along with the ranking probabilities (ie, bar plots with the corresponding table) and the SUCRA (ie, surface plots with the corresponding table). The distributions of the direct and indirect components of the evidence between comparisons and trials are respectively illustrated in the bar plots and the table at bottom left portion of each panel. Pairwise meta-analyses of the direct component of evidence by comparison are illustrated at bottom right portion of each panel. Myocardial infarction estimates in the IVUS-XPL trial (Impact of Intravascular Ultrasound Guidance on Outcomes of Xience Prime Stents in Long Lesions) include periprocedural events. *Credible interval. CrI indicates credible interval; ICA, invasive coronary angiography; IVUS, intravascular ultrasound; OCT, optical coherence tomography; OR, odds ratio; SUCRA, surface under the cumulative ranking curve; WF, weights by fixed-effect model; and WR, weights by random-effects model.

