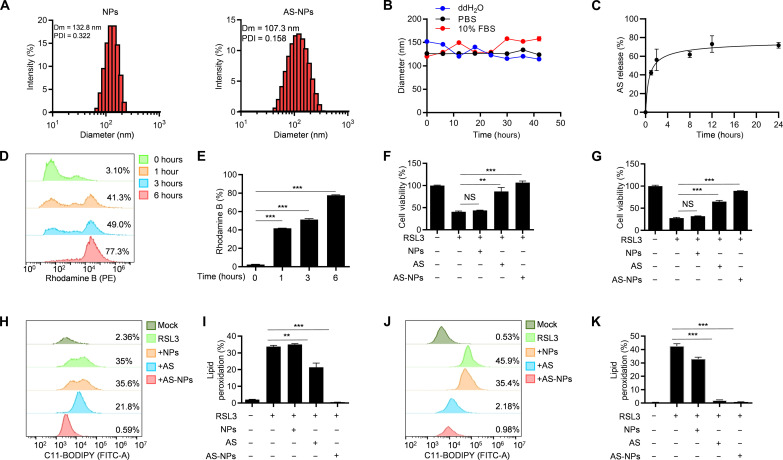
Fig. 5. AS-NPs inhibit ferroptosis.
(A) The diameter of the NPs and AS-NPs. (B) Stability of the NPs and AS-NPs in different media (ddH2O, PBS, 10% and FBS). Dm, diameter; PDI, polydispersity index. (C) Percentage of AS-NPs released at different time points. (D) The uptake of nanoparticle was analyzed by flow cytometry in HT-1080 cells. (E) The percentage of rhodamine B–positive HT-1080 cells. (F and G) Cell viability analysis of HT-1080 cells (F) or MDA-MB-231 cells (G) pretreated with AS or AS-NPs for 3 hours and then stimulated with 1 μM RSL3 for 8 hours. (H and J) Lipid peroxidation was analyzed by flow cytometry in HT-1080 cells (H) or MDA-MB-231 cells (J) pretreated with AS or AS-NPs for 3 hours and then stimulated with 1 μM RSL3 for 8 hours in the presence of C11-BODIPY. (I and K) The percentage of C11-BODIPY–positive HT-1080 cells (I) or MDA-MB-231 cells (K) pretreated with AS or AS-NPs for 3 hours and then stimulated with 1 μM RSL3 for 8 hours in the presence of C11-BODIPY. Data are the mean ± SEM, n = 3 biologically independent experiments [(E) to (G), (I), and (K)]. Statistical analysis was performed using an unpaired two-tailed Student’s t test. NS, P > 0.05, **P < 0.01, ***P < 0.001.

