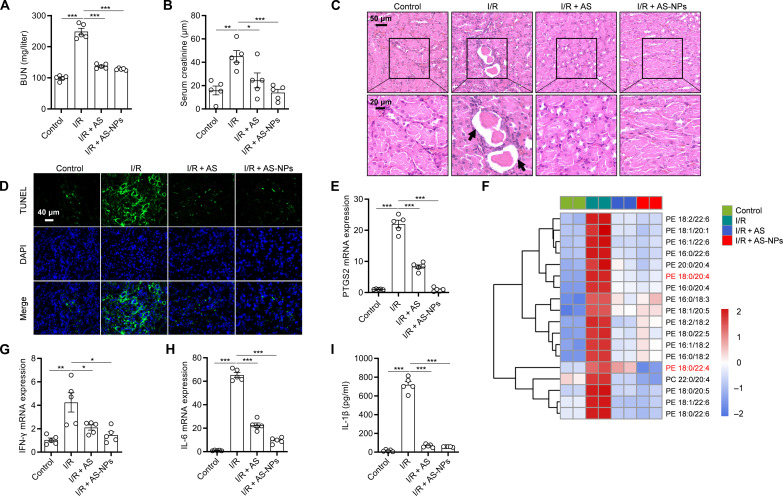
Fig. 6. AS-NPs protect against I/R-induced AKI.
(A) The levels of BUN. (B) The levels of serum creatinine. (C) Representative images of kidney sections with H&E staining. Black arrows indicate renal tubular injury during renal IRI. (D) Representative images of kidney sections with TUNEL staining. (E) The mRNA levels of PTGS2. (F) Heatmap of major PE/PC species in kidney of mice pretreated with AS or AS-NPs for 1 hour before kidney I/R. Each PE/PC species was normalized to the corresponding mean value. (G and H) IFN-γ (G) and IL-6 (H) in kidney were evaluated by real-time polymerase chain reaction (PCR). (I) Enzyme-linked immunosorbent assay (ELISA) analysis of IL-1β in serum of C57BL/6J mice after kidney I/R injury and pretreated with free AS or AS-NPs (20 mg/kg). Data are the mean ± SEM, n = 5 biologically independent mice [(A), (B), (E), and (G) to (I)]. Statistical analysis was performed using an unpaired two-tailed Student’s t test. *P < 0.05, **P < 0.01, ***P < 0.001.

