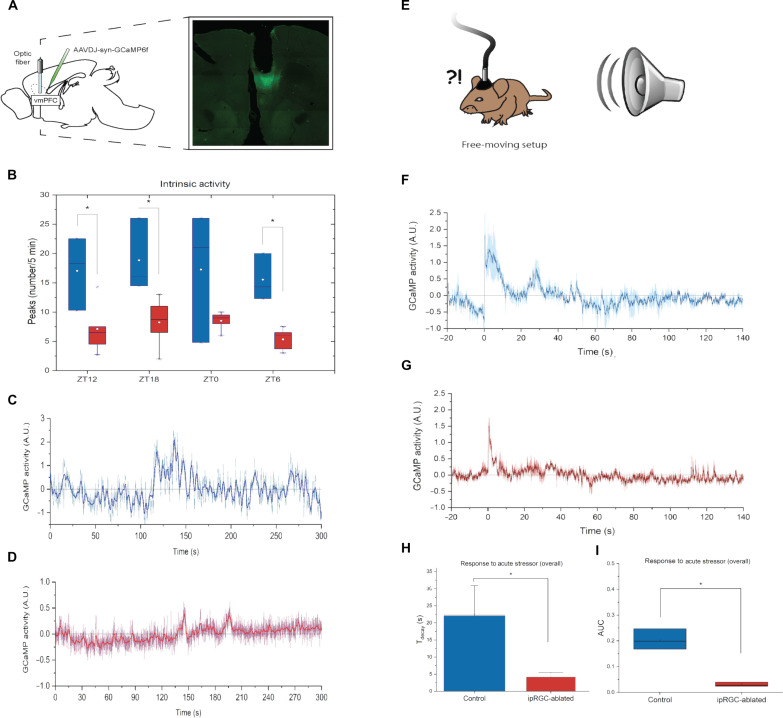
Fig. 2. vmPFC activity in response to a stressful stimulus is depressed in ipRGC-ablated mice.
(A) Neurons were transduced with GCaMP6f; an optical fiber was implanted above the area. (B) We recorded in vivo neuronal activity from the vmPFC. Recordings of endogenous activity showed a significantly higher number of peaks in controls relative to Brn3bDTAs at ZT12 (P = 0.037), ZT18 (P = 0.028), and ZT6 (P = 0.002). A trend in the same direction is present at ZT0 (P = 0.116). All values are means ± SEM. (C and D) Examples to highlight high intrinsic activity recording from a control mouse (C) versus a low intrinsic activity trace from a Brn3bDTA (D). Traces are recordings of individual animals; the dark/thicker line is a rolling time average. (E) Mice were exposed to a loud sound—a nonvisual fear-evoking stimulus. (F and G) Normalized Ca2+-dependent fluorescence in response to the noise (delivered at time = 0) in controls (F) and Brn3bDTA mice (G). Traces are means (±SEM, hued area) of recordings from three animals, each averaged over multiple trials. (H) Fluorescence decayed to baseline more slowly in controls than in ipRGC-ablated mutants (22.1 ± 5.9 s versus 4.1 ± 0.9 s) (P = 0.039). (I) The area under the curve of vmPFC activity in response to this stimulus was significantly higher in controls (0.204 ± 0.0230) versus ipRGC-ablated mice (0.030 ± 0.0048) (P = 0.002).

